
Solana Price Prediction: SOL ETF Inflows Hit $10M as Price Holds $75

0
0
Solana is trading close to $75.47 today. The coin has caught fresh attention after spot Solana ETFs pulled in $10.26 million last week. That is roughly 70 times more than the previous week's total of about $144,930, based on data from SoSoValue.
This marks the seventh straight week of positive inflows for these funds. It is also the strongest weekly haul since May 22. Most of the money came from Bitwise and Morgan Stanley.
The inflow trend stands out even more when compared to Bitcoin. Spot BTC funds lost $389.7 million over the same week, even as demand for the altcoin kept climbing.
Why are Solana ETF inflows rising right now?
Institutional demand has stayed steady over the past several weeks. Analysts tracking the SoSoValue figures point to consistent buying from a small group of fund managers rather than broad market-wide demand.
If this pattern holds and picks up pace through the week, some traders expect it could give the token room to extend its recent gains. Nothing is guaranteed here, and inflows can reverse quickly if market mood shifts.
What do SOL derivatives markets show today?
Trading activity has picked up sharply. Here is a quick snapshot of the current market data.
Metric | Value | Change |
SOL Price | $75.47 | — |
24h Trading Volume | $3.30B | +64.24% |
Open Interest | $4.89B | -0.62% |
Overall Long/Short Ratio | 0.9099 | Slight short bias |
Binance SOL/USDT Ratio | 2.4341 | Bullish |
Top Traders Account Ratio | 2.7106 | Bullish |
Top Traders Position Ratio | 1.606 | Bullish |
Options Volume | $5.68B | +28.67% |
Options Open Interest | $82.63M | +2.09% |
Total Liquidations (24h) | $5.58M | — |
Long Liquidations | $4.51M | — |
Short Liquidations | $1.07M | — |
As per CoinGlass data, trading volume jumped over 64% in a single day, but open interest barely moved. That usually means traders are actively swapping positions rather than piling on fresh leverage.
The broader market shows a slight short bias, with the long/short ratio sitting below 1. But top traders on Binance tell a different story. Their account and position ratios both lean bullish, suggesting bigger players are more confident than the average retail trader right now.
Liquidations also paint an uneven picture. Long positions took the bigger hit, losing $4.51 million versus just $1.07 million on the short side. That points to some volatility shaking out over-leveraged bulls near current levels.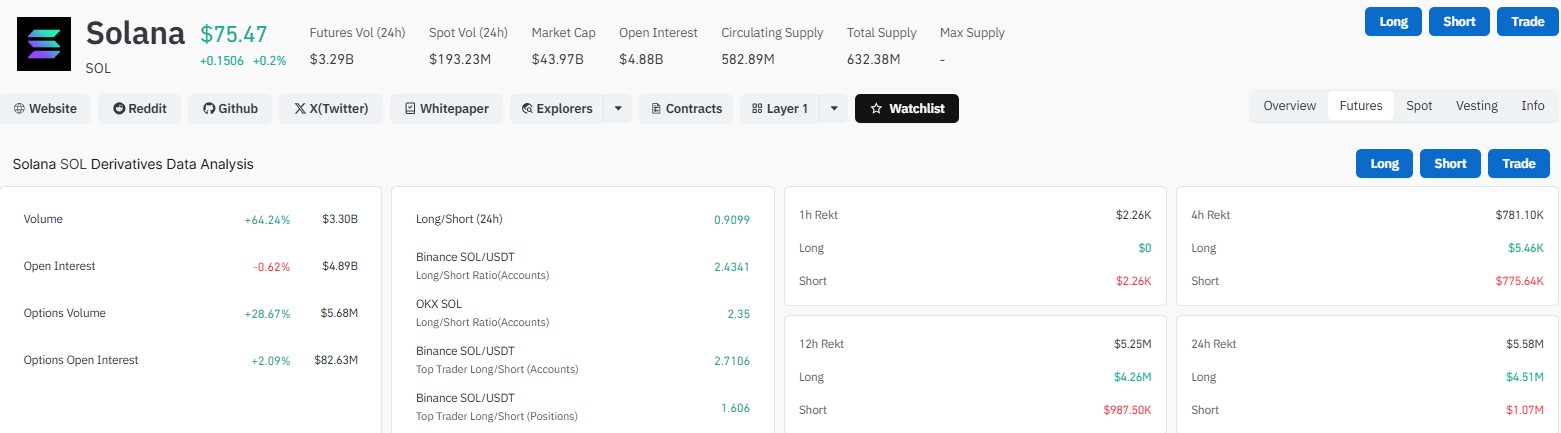
What are the key support and resistance levels for SOL?
The token recently broke out of a symmetrical triangle pattern on the charts. Price is now consolidating just above $75.5 after that move.
It is holding near its 20 EMA at $75.15 and its 50 EMA at $75.49. Both are acting as short-term support right now. The next big hurdle sits at the 100 EMA, around $78.10.
If this zone holds and price pushes back above $78.10, the move could stretch toward the $82 to $85 range. The 200 EMA near $89.26 stands as the bigger upside target beyond that.
A clean break above the 200 EMA would strengthen the bullish case further and could open a path toward the $95 to $100 zone.
On the flip side, losing the 20/50 EMA cluster near $75 would weaken the setup. That could send the price down to the $72 to $70 support area.
A deeper break below the triangle breakout zone would call the bullish continuation idea into question.
Is Solana price expected to go up or down?
Taken together, the setup leans cautiously bullish for now. Top traders are positioned long, fund inflows are climbing, and price is holding above short-term support.
Still, the elevated liquidation activity and the slight short bias across the wider market suggest this level near $75 remains an important battleground. How the coin behaves here over the next few sessions may decide whether the breakout continues or fades into a retest.
Traders watching this week will likely keep an eye on whether inflows keep climbing and whether price can clear that $78.10 resistance with real volume behind it.
Disclaimer
This article is for informational purposes only and does not constitute financial, investment, or trading advice. Cryptocurrency markets are highly volatile and carry significant risk. Always do your own research and consult a licensed financial advisor before making any investment decisions.
0
0

 Manage all your crypto, NFT and DeFi from one place
Securely connect the portfolio you’re using to start.

0
0

0
0


0
0