
Ethereum Crypto Eyes $2,000 as Uniswap Fees Surge 183%

0
0

Trading at $1,885.58 on July 15, 2026, Ethereum crypto sits precisely at its daily pivot of $1,881.09. This level captures the tension between an improving trend structure and a market gripped by Extreme Fear. The outcome of this standoff will define the next directional move.
Key takeaways
- The daily MACD histogram at 22.71 signals genuine momentum acceleration, not a tired bounce
- Fear & Greed Index at 25 — deep Extreme Fear territory — contrasts sharply with the improving technical structure
- DEX fee growth — Uniswap V3 up 183.86% over 30 days — confirms on-chain activity is accelerating
- A daily close above $1,930 would open the path toward $2,000; a break below EMA50 at $1,806.49 would invalidate the bull case
Daily Timeframe: The Macro Bias Is Constructive
The daily chart presents a structurally constructive picture, but one significant caveat keeps the macro outlook in check. Broader market context supports cautious optimism: total crypto market cap stands at approximately $2.30 trillion with Bitcoin dominance at 56.32%, according to CoinGecko data. Fortune also highlighted Ethereum’s price action as recently as July 13, 2026.
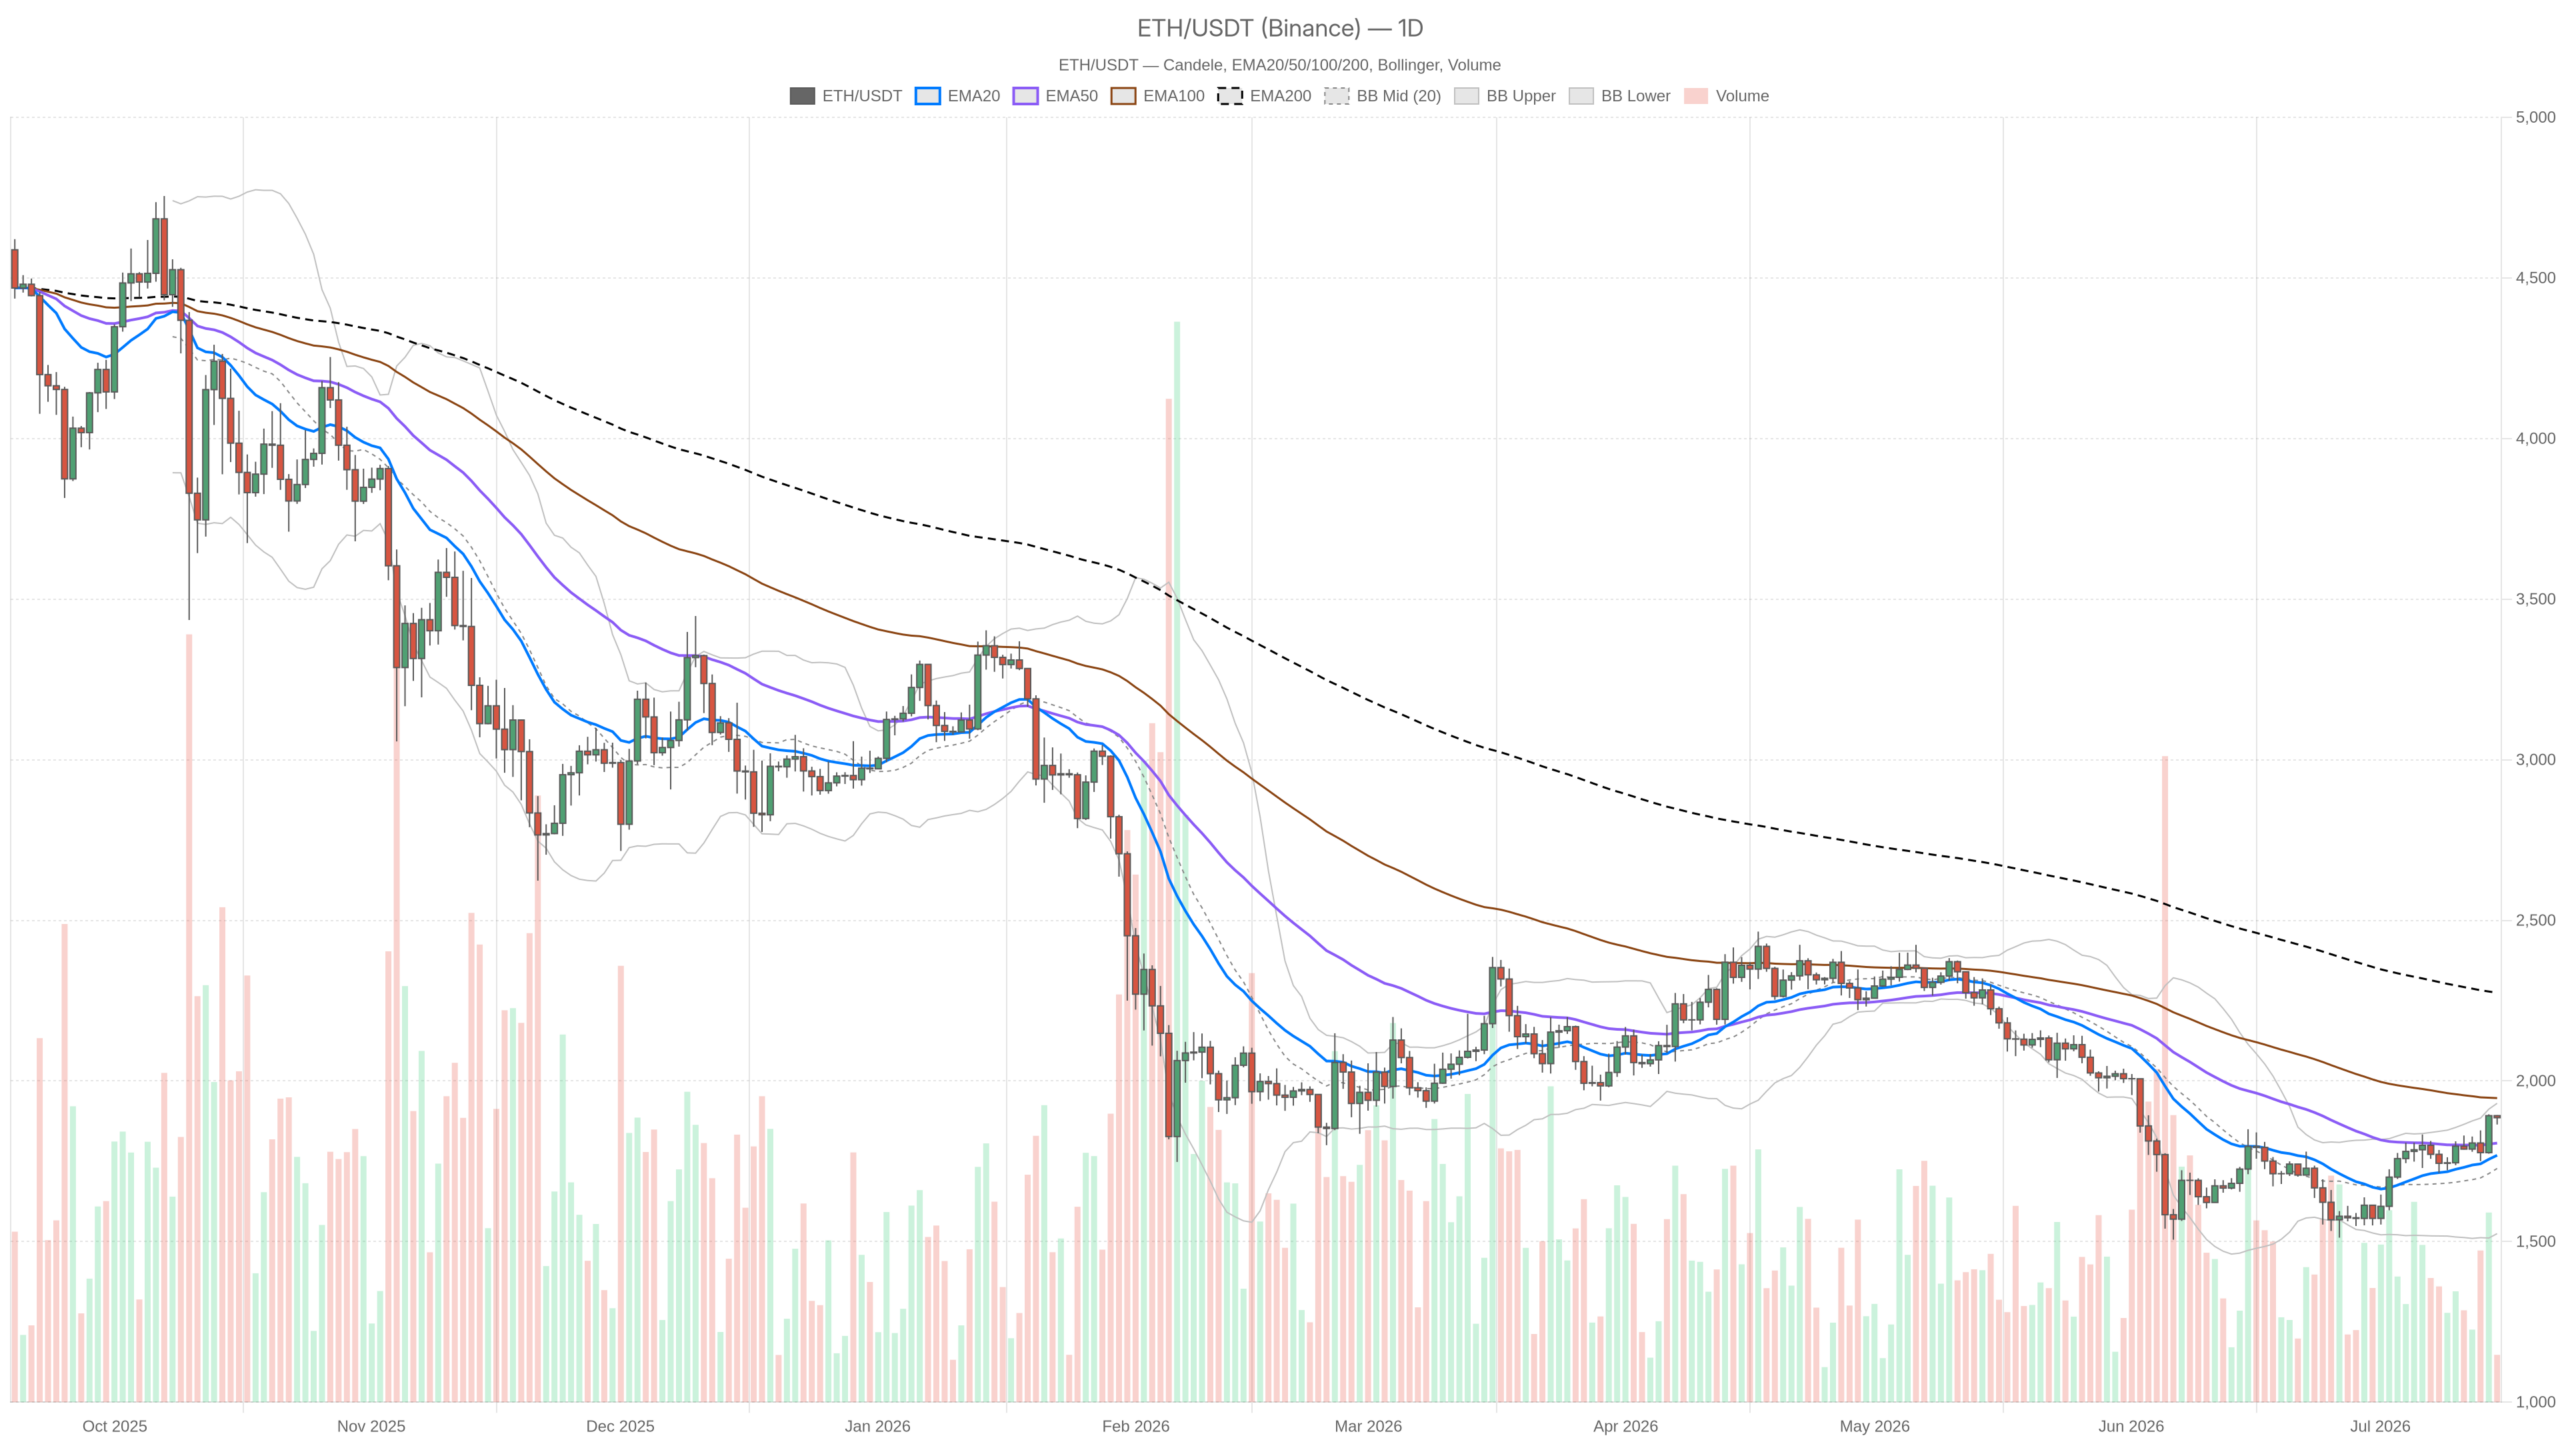
Price has closed above both the EMA20 at $1,768.46 and EMA50 at $1,806.49, forming a clean bullish stack. This alignment historically precedes sustained trending phases. Notably, the MACD prints a line of 30.53 against a signal of 7.81, with a histogram of 22.71 — expansion that signals genuine momentum rather than a tired bounce. RSI14 at 63.73 remains elevated but has not yet entered overbought territory, leaving room before the 70 ceiling becomes a structural obstacle.
The Bollinger Band configuration, however, demands careful interpretation. With the midline at $1,727.48, price has pushed significantly above the band’s center. The upper band at $1,930.37 sits within roughly $45, and daily ATR at $72.59 means that gap represents less than one average daily range. A single strong session could test the upper band, which frequently acts as a short-term exhaust valve.
The critical macro level remains EMA200 at $2,274.49 — still approximately $389 above the current price. Until that threshold is reclaimed, the longer-term picture remains a recovery narrative rather than a new bull market. Pivot levels at R1 $1,897.81 and S1 $1,868.87 define the immediate battlefield.
Hourly Structure: Bullish but Losing Steam
The hourly chart confirms the daily uptrend but reveals early cracks in momentum that warrant careful attention. Price at $1,885.87 holds above all three EMAs — EMA20 at $1,868.26, EMA50 at $1,841.17, and EMA200 at $1,798.08 — confirming full bullish alignment with hourly follow-through.
However, the 1H MACD histogram sits at -2.66, marginally negative. The MACD line at 14.74 has dipped below the signal line at 17.41, creating a modest but real divergence from price action. This does not constitute a reversal signal on its own, but it does indicate that buying pressure behind the push above $1,880 has softened.
Moreover, the Bollinger Bands on the 1H chart are squeezed tight, with the upper band at $1,888.79 and the lower at $1,865.24 — a range of just $23.55 against a $12.05 ATR. Price is coiling, and the next breakout from this band will carry significant weight regardless of direction.
15-Minute Execution Context
The 15-minute chart shows the coiling pattern most clearly, with the path of least resistance still tilting upward on the smallest timeframe. EMA20 at $1,878.44, EMA50 at $1,874.36, and EMA200 at $1,838.87 all stack below price in bullish order. The MACD histogram at 0.86 has just flipped positive, producing a micro-signal that short-term momentum is attempting to reassert itself.
That said, RSI at 60.05 sits comfortably in neutral-to-bullish territory without flagging overextension. The room between the current price and the upper band at $1,890.30 remains thin. For traders managing entry timing rather than trend positioning, the 15-minute setup functions best as confirmation of a hold rather than an aggressive entry signal.
DeFi Activity: On-Chain Fees Tell Their Own Story
On-chain data provides fundamental credibility to the improving technical picture, with DEX fee growth confirming genuine network activity acceleration. One dimension often ignored in purely technical analysis is what happens on-chain, and the data from DefiLlama paints a compelling backdrop for Ethereum crypto specifically.
Uniswap V3 fees have surged 183.86% over 30 days, while Uniswap V4 has recorded a 122.3% increase over the same period. Fluid DEX is even more aggressive at +130.38% over seven days. These figures are not statistical noise — this level of DEX fee growth reflects real on-chain activity acceleration, which historically precedes or accompanies sustained ETH price strength.
Curve DEX stands as the outlier, with fees collapsing 86.11% over seven days. However, that dynamic appears protocol-specific rather than indicative of a broader negative trend. The overall Ethereum DeFi ecosystem shows clear signs of waking up.
Bullish and Bearish Scenarios
In short, the bullish case hinges on Ethereum holding above $1,868 and the hourly MACD histogram stabilizing, which would favor a push toward R1 at $1,897.81 and ultimately the upper Bollinger Band at $1,930.37. A confirmed daily close above $1,930 would open the conversation about the psychologically significant $2,000 level and beyond. The DeFi fee surge adds fundamental credibility to this scenario.
Invalidation of the bull case requires a daily close below EMA50 at $1,806.49, which would suggest the entire bounce represents a relief rally within a larger downtrend rather than the beginning of a sustained recovery.
The bearish scenario, conversely, does not require a catastrophe — merely a failure to follow through. Price sitting against the upper Bollinger Band with the Fear & Greed Index at 25 and the 1H MACD already rolling over is precisely the combination that produces sharp mean-reversion moves.
If sellers emerge at the $1,888–$1,897 zone and push price back below the 1H lower band at $1,865, the first meaningful support appears at the 1H pivot of $1,881.54, followed by the daily S1 at $1,868. A break of $1,868 with volume would shift the short-term narrative back to ranging. The bearish case is fully invalidated on a clean 4H or daily close above $1,930.
Positioning and Risk
The current environment demands disciplined position sizing, as compression between well-defined support and resistance levels tends to produce choppy price action rather than clean directional moves. The daily momentum is genuine — MACD histogram expansion and the EMA stack are not decorative — but the market is advancing against a backdrop of Extreme Fear sentiment that keeps participation thin.
Volatility remains elevated, with daily ATR at $72.59 meaning intraday swings of that magnitude should be treated as normal. They only become significant if they translate into daily closing structure changes. The $1,806–$1,870 zone now represents the ground that long-term bulls must defend.
Above $1,930, the structure changes qualitatively. Between those two levels, the market remains in a decision phase — and decision phases tend to last longer and cut harder in both directions than most participants expect. Managing position size carefully during this compression is not timidity; it is discipline.
FAQ
What is the most important support level for Ethereum right now?
The daily S1 at $1,868.87 and the EMA50 at $1,806.49 represent the two critical support tiers. A break below $1,868 would shift the short-term narrative to ranging, while a close below $1,806.49 would invalidate the bullish structure entirely.
What would invalidate the bullish case for Ethereum?
A daily close below the EMA50 at $1,806.49 would suggest the entire recent bounce is a relief rally within a larger downtrend. On the upside, failure to break and hold above $1,930 would keep the structure range-bound rather than confirming a new uptrend.
Why does the Fear & Greed Index matter for this setup?
The Fear & Greed Index at 25 indicates Extreme Fear, meaning the crowd is not participating in the current rally. Historically, price advances against extreme fear can either trap late buyers or signal smart-money accumulation — the resolution depends on whether the technical structure holds.
Disclaimer: This article is for informational purposes only and does not constitute financial advice, an investment recommendation, or a solicitation to buy or sell any financial instrument or cryptocurrency. The analysis provided is not indicative of future results. Investing in crypto assets and financial markets carries a high risk of capital loss. Always do your own research (DYOR) and consult a qualified financial advisor before making any decision.
Article produced with the assistance of artificial intelligence and reviewed by the editorial team.
0
0


 Manage all your crypto, NFT and DeFi from one place
Securely connect the portfolio you’re using to start.

0
0

0
0

