Kaspa (KAS) Price Slips Below Key Level Amid Long Liquidations
2d ago•

bullish:
0
bearish:
0
Share

Only a few altcoins have been able to outperform Bitcoin (BTC) this year. But if there is one that has continuously remained in that fold, it is Kaspa (KAS), the project that utilizes the same Proof-of-Work (PoW) mechanism as Bitcoin.
While KAS price has increased over 400% in the last 365 days, recent data shows it may struggle to regain the momentum.
Kaspa Faces Imminent Breakdown Due to Wipeout Positions
Kaspa’s current position below the Exponential Moving Average (EMA) supports the above point.
This indicator highlights price changes and provides insights into a cryptocurrency’s short—and long-term trends. This analysis focuses on the short-term EMA—specifically, the 20 EMA (blue).
For most of July, KAS traded above the EMA, indicating a bullish trend. This was one reason the value reached $0.18 earlier. At press time, the cryptocurrency trades below the 20 EMA, suggesting a bearish trend. The last time KAS’ price dropped by 20%, it reached $0.13.
Read More: Kaspa (KAS): A Detailed Guide to What It Is and How It Works
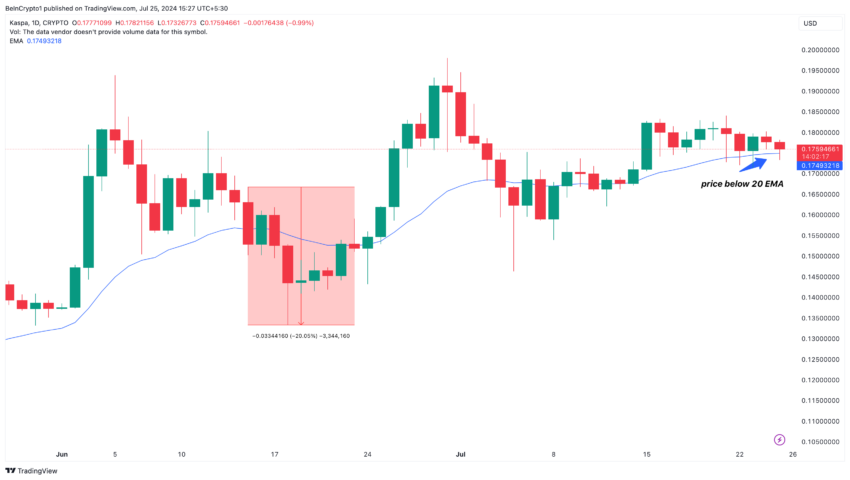 Kaspa Daily Analysis. Source: TradingView
Following the recent decline, long liquidation in the market is fifteen times that of shorts. Liquidation occurs when an exchange forcefully closes a trading position. This is because there is no longer enough margin to cover the position, meaning the trade has to be settled.
Therefore, the rise in long liquidations proves that the KAS decline negatively affected traders who placed bets on a price increase. However, it is worth noting that liquidation can also affect price trends.
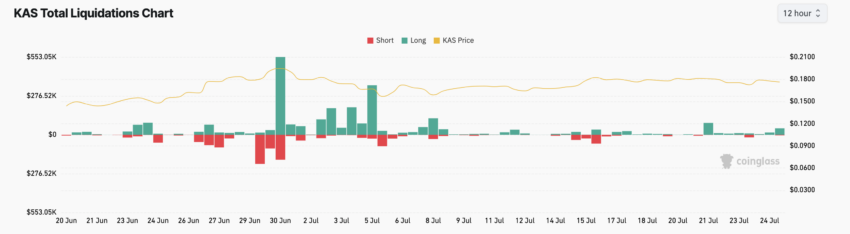 Kaspa Liquidation. Source: Coinglass
From a trading point of view, a rise in long liquidation dumps into the underlying support. As such, Kaspa’s next move could be a notable breakdown below the press time value.
KAS Price Prediction: A Pullback to $0.15 Could Be Next
Further assessment of the daily KAS/USD chart shows weakness in the bullish trend. This is the indication the Directional Movement Index (MDI) reveals. The DMI simply measures the strength and direction of a trend.
As of this writing, the +DMI (green) is down, while the – DMI (red) is trying to rise above -17.22. If the negative end rises above the positive directional strength, the price of KAS may drop as it offers more power to the downtrend.
In addition, the Average Directional Index (ADX) yellow indicates that the overall cryptocurrency trend is weak. Typically, a reading of 25 or above for the ADX (yellow) suggests strong directional movement.
Read More: Kaspa (KAS) Price Prediction 2024/2025/2030
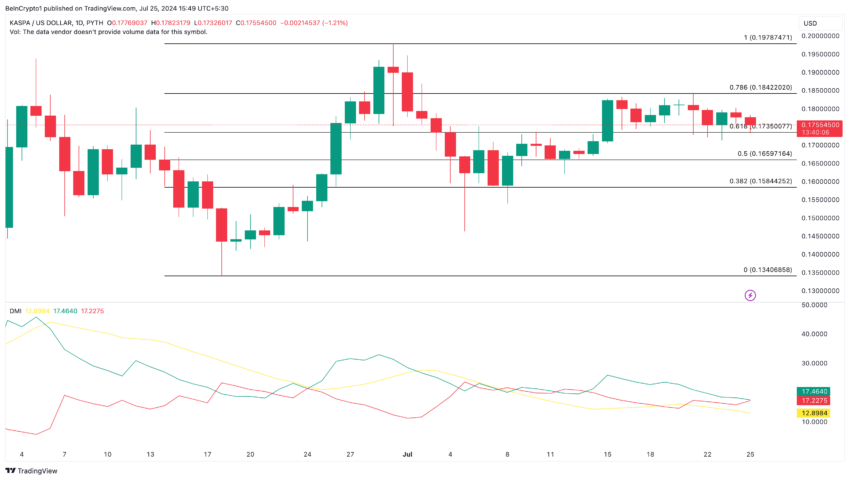 Kaspa Daily Analysis. Source: TradingView
But at press time, it is lower. Thus, KAS’ price may either consolidate or trend downward. Should selling pressure increase, the chart above shows that the crypto may experience a nominal pullback to the 38.2% Fibonacci retracement level, which is at $0.15.
However, BeInCrypto observes that the Kaspa hash rate has been increasing lately. When the hash rate increases, miner costs also increase, which boosts investor confidence and demand for cryptocurrency. If sustained, the bearish bias could be invalidated, and KAS price may jump to $0.19.
2d ago•
bullish:
0
bearish:
0
Share


 Manage all your crypto, NFT and DeFi from one place
Securely connect the portfolio you’re using to start.

bullish:
0
bearish:
0


bullish:
0
bearish:
0
