Toncoin (TON) Price Faces Crucial Resistance, Hints at Possible Drawdown
1d ago•

bullish:
0
bearish:
1
Share

Before Toncoin’s (TON) recent bounce to $6.75, the cryptocurrency experienced a 12% decline over the last six days. TON initially broke below a vital area and has since been unable to rise past it.
Based on this analysis, it can be challenging for the token to break this resistance. As such, the price may remain below $7 in the coming days.
Toncoin Metric Reveals Potential Sell-Off
According to IntoTheBlock, TON’s decline over the last month has ensured that the number of holders in profits is no longer at the previous peak. Furthermore, the In/Out of Money Around Price (IOMAP) reveals how the price may fare, with data showing a significant sell-wall.
The IOMAP group addresses holding a crypto asset based on their unrealized losses or profits. If a large number of addresses are in unrealized loss, the price range will act as resistance. However, if the higher number is in profits, it will be a support point for the crypto in question.
For Toncoin, 2,290 addresses that purchased 1.15 million tokens at an average price of $7.05 are currently in unrealized losses. This is a higher figure than the 1,510 addresses that bought 636,690 TON tokens at an average price of $6.61.
Read More: 6 Best Toncoin (TON) Wallets in 2024
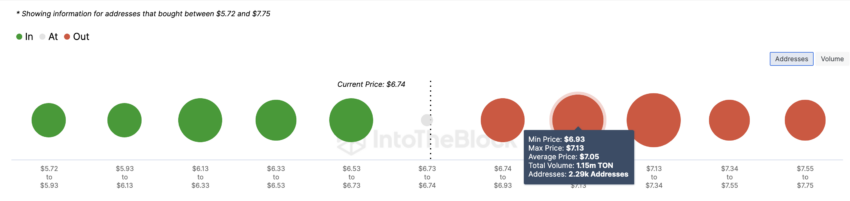 Toncoin In/Out of Money Around Price. Source: IntoTheBlock
This means that if TON’s price continues its bounce and reaches at least $6.93, these addresses may place a significant sell order, potentially causing the price to fall.
If this happens, TON’s next level could be around $6.43 and $6.52. The supply of exchanges provides further evidence of this.
On July 25, Toncoin’s supply on exchanges was a little under seven million. But at press time, the figure had climbed to 7.32 million. The increase in this metric implies that investors are sending more tokens out of self-custody, suggesting potential selling pressure.
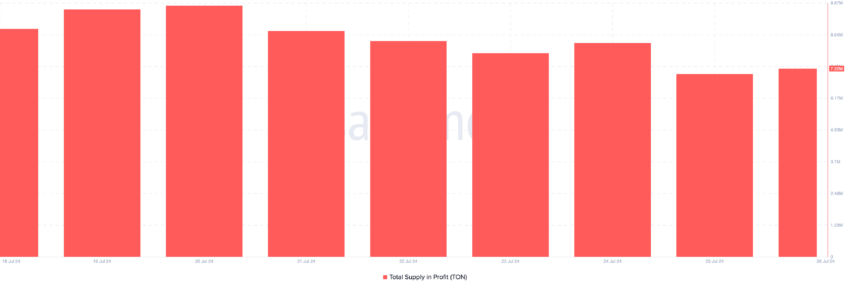 Toncoin Supply on Exchanges. Source: Santiment
If the number were lower, it would have implied lower selling pressure and increased potential for prices to jump. But If this exchange supply continues to rise, TON’s price decrease, as mentioned above, could be validated.
TON Price Prediction: Potential Rebound or Further Decline?
Between May and July 21, TON formed an ascending trendline that ensured that the price did not break below $6.03. However, press time data shown on the daily chart reveals that the price has slipped below the trendline and the support at $7.00.
The Relative Strength Index (RSI) corroborates this condition, as the reading is below the neutral line. When the RSI is below the midpoint, it means that the momentum around a cryptocurrency is bearish. Hence, the price is likely to continue a downward trend.
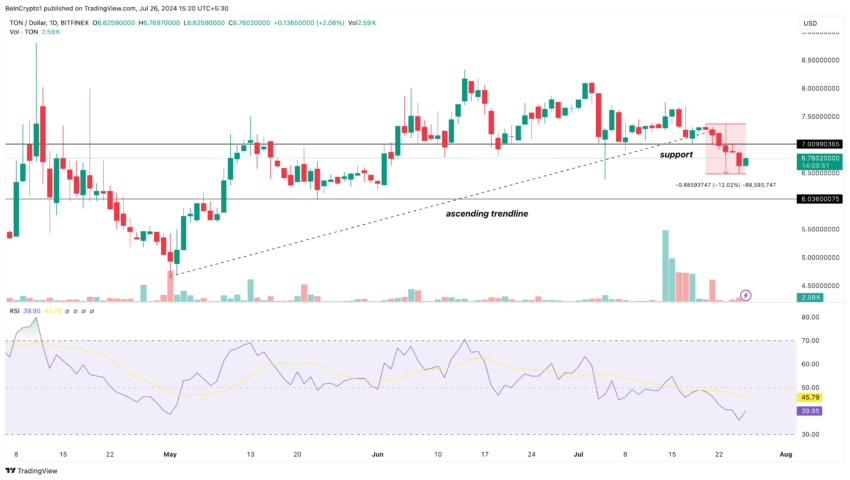 Toncoin Price Analysis. Source: TradingView
Another indicator that supports the bearish bias is the Ichimoku cloud. The Ichimolky cloud spots support and resistance levels and identifies trend direction. If the cloud is below the price, the trend is bullish.
However, for TON, the cloud is above the price, indicating a bearish momentum. From the chart shown below, Toncoin’s price could decline to $6.57, which is where the 23.6% Fibonacci retracement positions.
Read More: What is Notcoin (NOT)? A Guide to the Telegram-Based GameFi Token
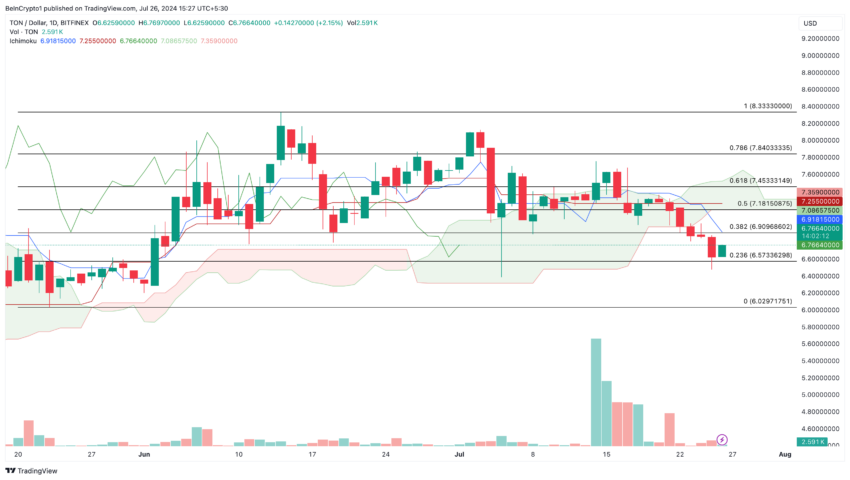 Toncoin Daily Analysis. Source: TradingView
But if buying pressure increases, this forecast may be invalidated. If that happens, TON can rebound to $7.18 or as elevated as $7.45.
1d ago•
bullish:
0
bearish:
1
Share


 Manage all your crypto, NFT and DeFi from one place
Securely connect the portfolio you’re using to start.

bullish:
0
bearish:
0


bullish:
0
bearish:
0
