HYPE Price Stalls After 60% Surge, but a New All-Time High Stays on the Table

0
0

Hyperliquid (HYPE) price is up over 6% in the past 24 hours, recovering from a pullback that followed its 60% year-to-date surge driven by its expansion into 24/7 TradFi perpetual trading and growing DEX market share.
The pullback was technically warranted. A hidden bearish divergence on the daily Relative Strength Index (RSI), a momentum oscillator, flagged weakening momentum at the highs. However, a fresh bullish divergence has now appeared on the same timeframe, and spot buyers are returning while derivatives traders remain heavily short. That combination sets up a potential squeeze.
Breakout Target Hit but Hidden Divergence Triggers Pullback
The daily chart shows that the HYPE price broke out of an inverse head-and-shoulders pattern on March 10. The move pushed HYPE from around $25 toward $43, nearly fulfilling the pattern’s measured move target.
However, the rally came with a warning. Between October 2 and March 18, the price printed a lower high while the RSI formed a higher high, with the latest RSI peak reaching the overbought zone. That hidden bearish divergence signaled that the uptrend was losing steam despite appearing strong on the surface.
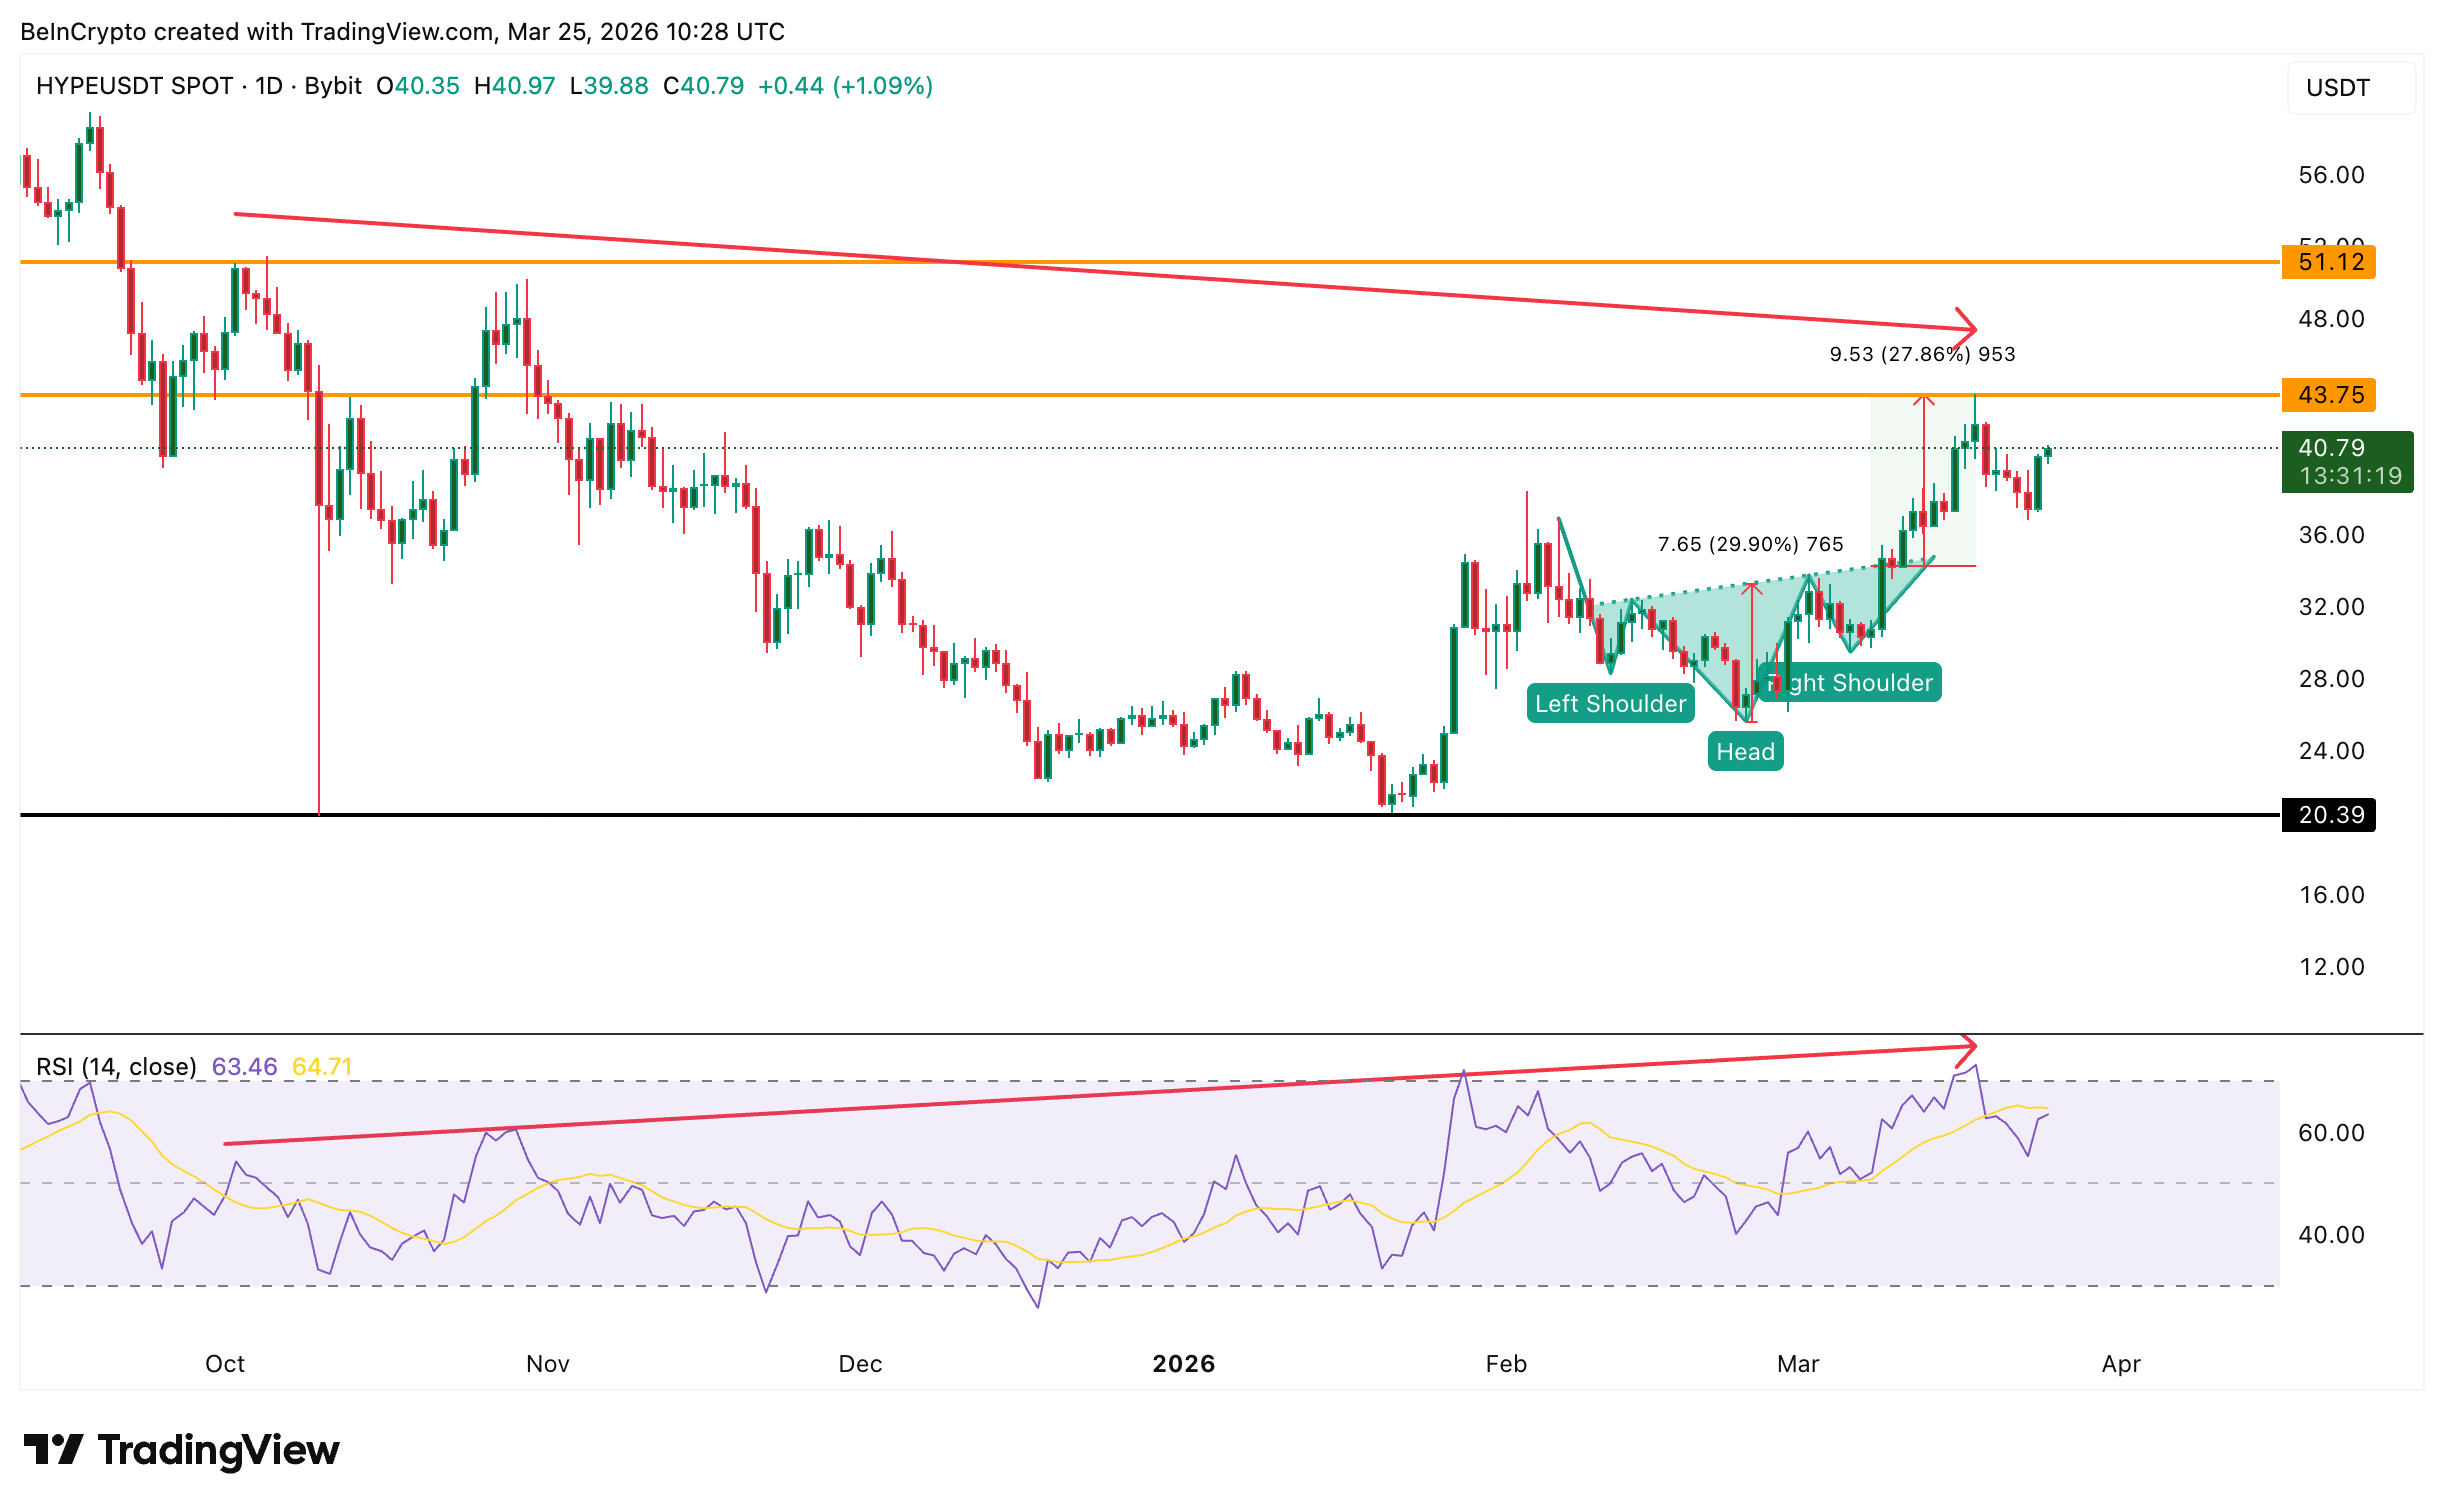 Inverse H&S and RSI Divergence: TradingView
The pullback that followed was not a surprise. HYPE corrected from the $43 area before bouncing to $40, at press time. The pattern target has been mostly fulfilled, which means the next move depends on whether fresh demand enters or sellers maintain pressure.
What the spot market and derivatives positioning are doing right now answers that question.
Want more token insights like this? Sign up for Editor Harsh Notariya’s Daily Crypto Newsletter here.
Spot Buyers Return as $29 Milliom in Shorts Build a Squeeze Setup
On March 24, exchange inflows spiked to $5.76 million worth of HYPE, a clear sign that sellers were moving tokens onto exchanges during the pullback. That selling pressure came after three relatively quiet days, during which the HYPE price’s weekly performance was roughly -2%.
However, as of March 25, the flow has completely reversed. Net flows have flipped to negative $818,350, meaning more HYPE is leaving exchanges than entering. When tokens move off exchanges, it typically signals that spot buyers are accumulating rather than preparing to sell.
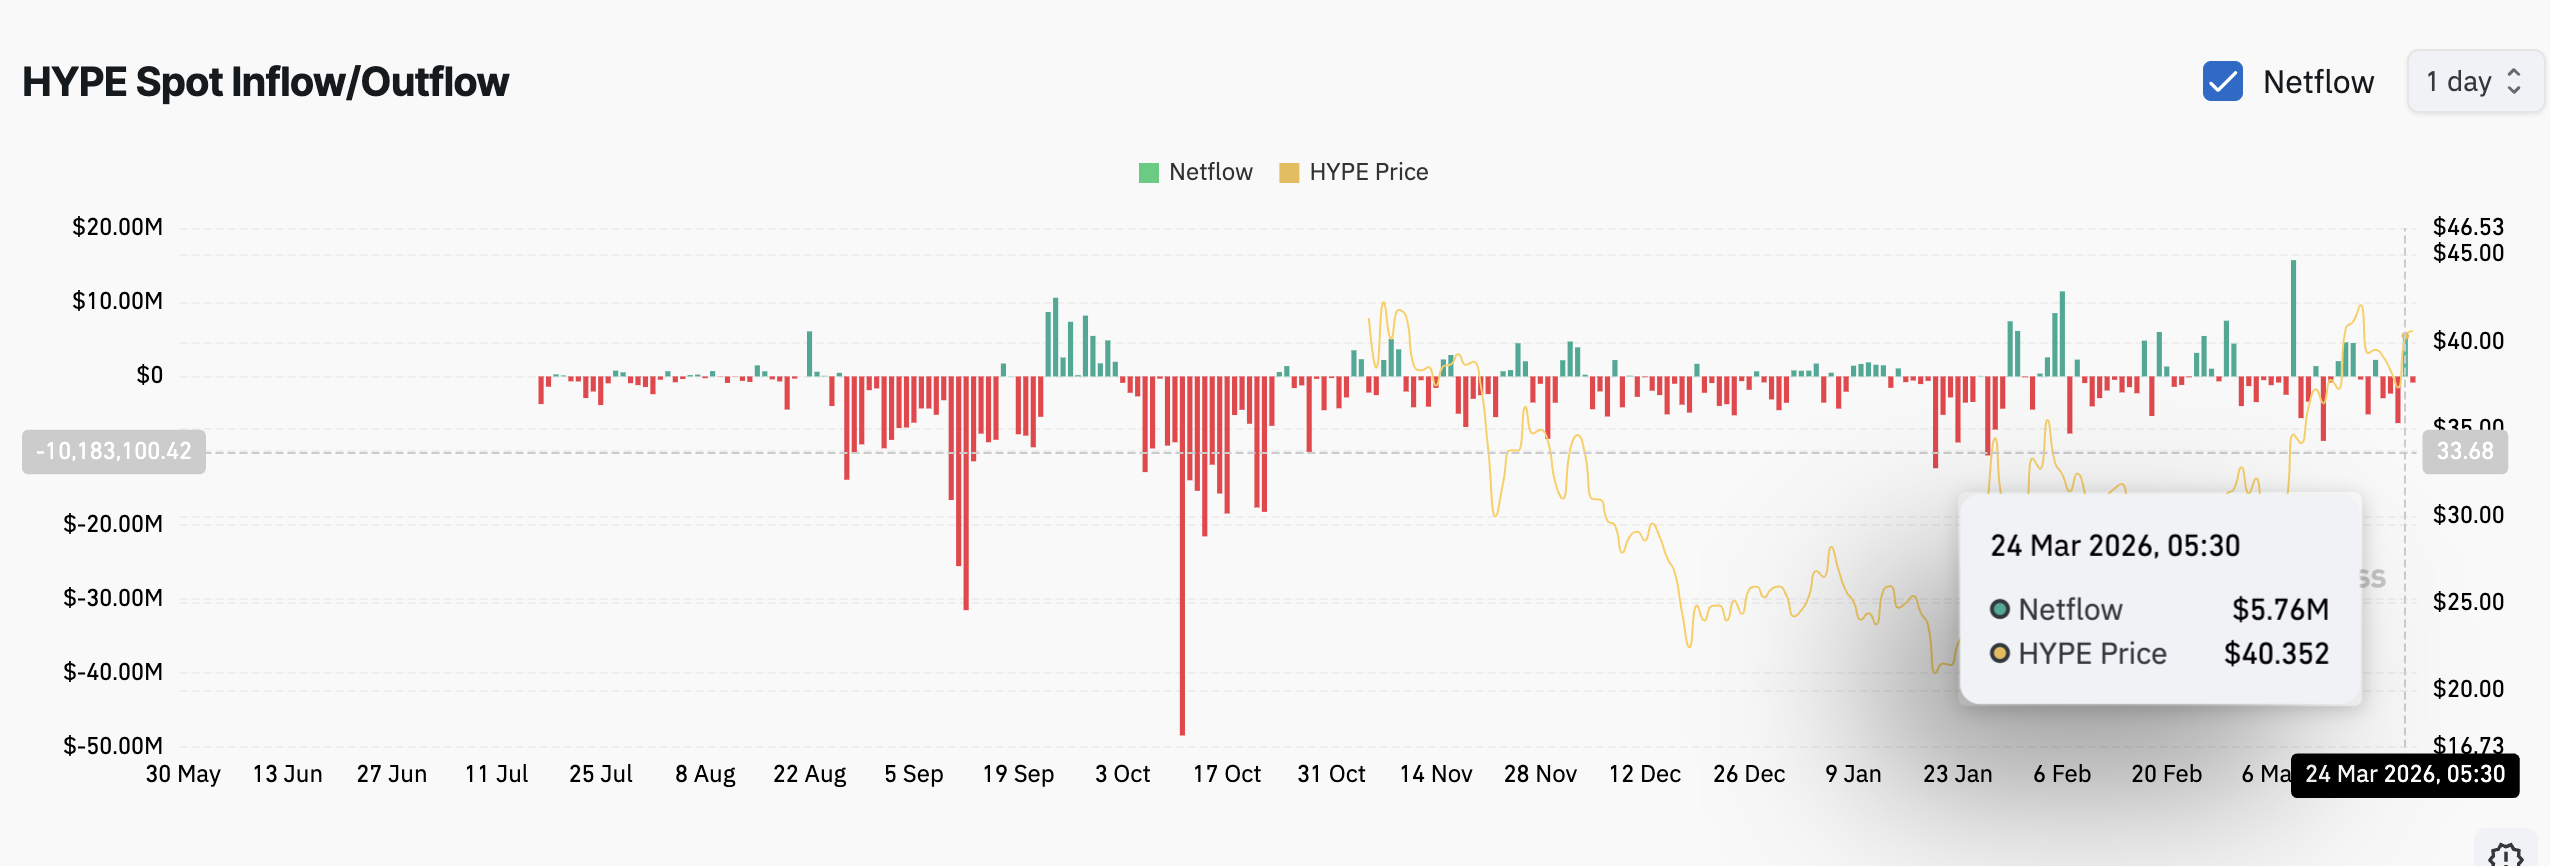 HYPE Spot Inflow and Outflow: Coinglass
The derivatives market adds fuel to this shift. The Bybit HYPE/USDT perpetual liquidation map over the past seven days shows cumulative short liquidation leverage at almost $29 million against just $22 million in longs. The market leans short, with a significant cluster of short liquidations sitting above $45.
If the price pushes above $45, that short-heavy positioning could trigger a cascade of forced buybacks, accelerating the move higher. The majority of traders are betting that the pullback continues deeper, but the spot market is telling a different story.
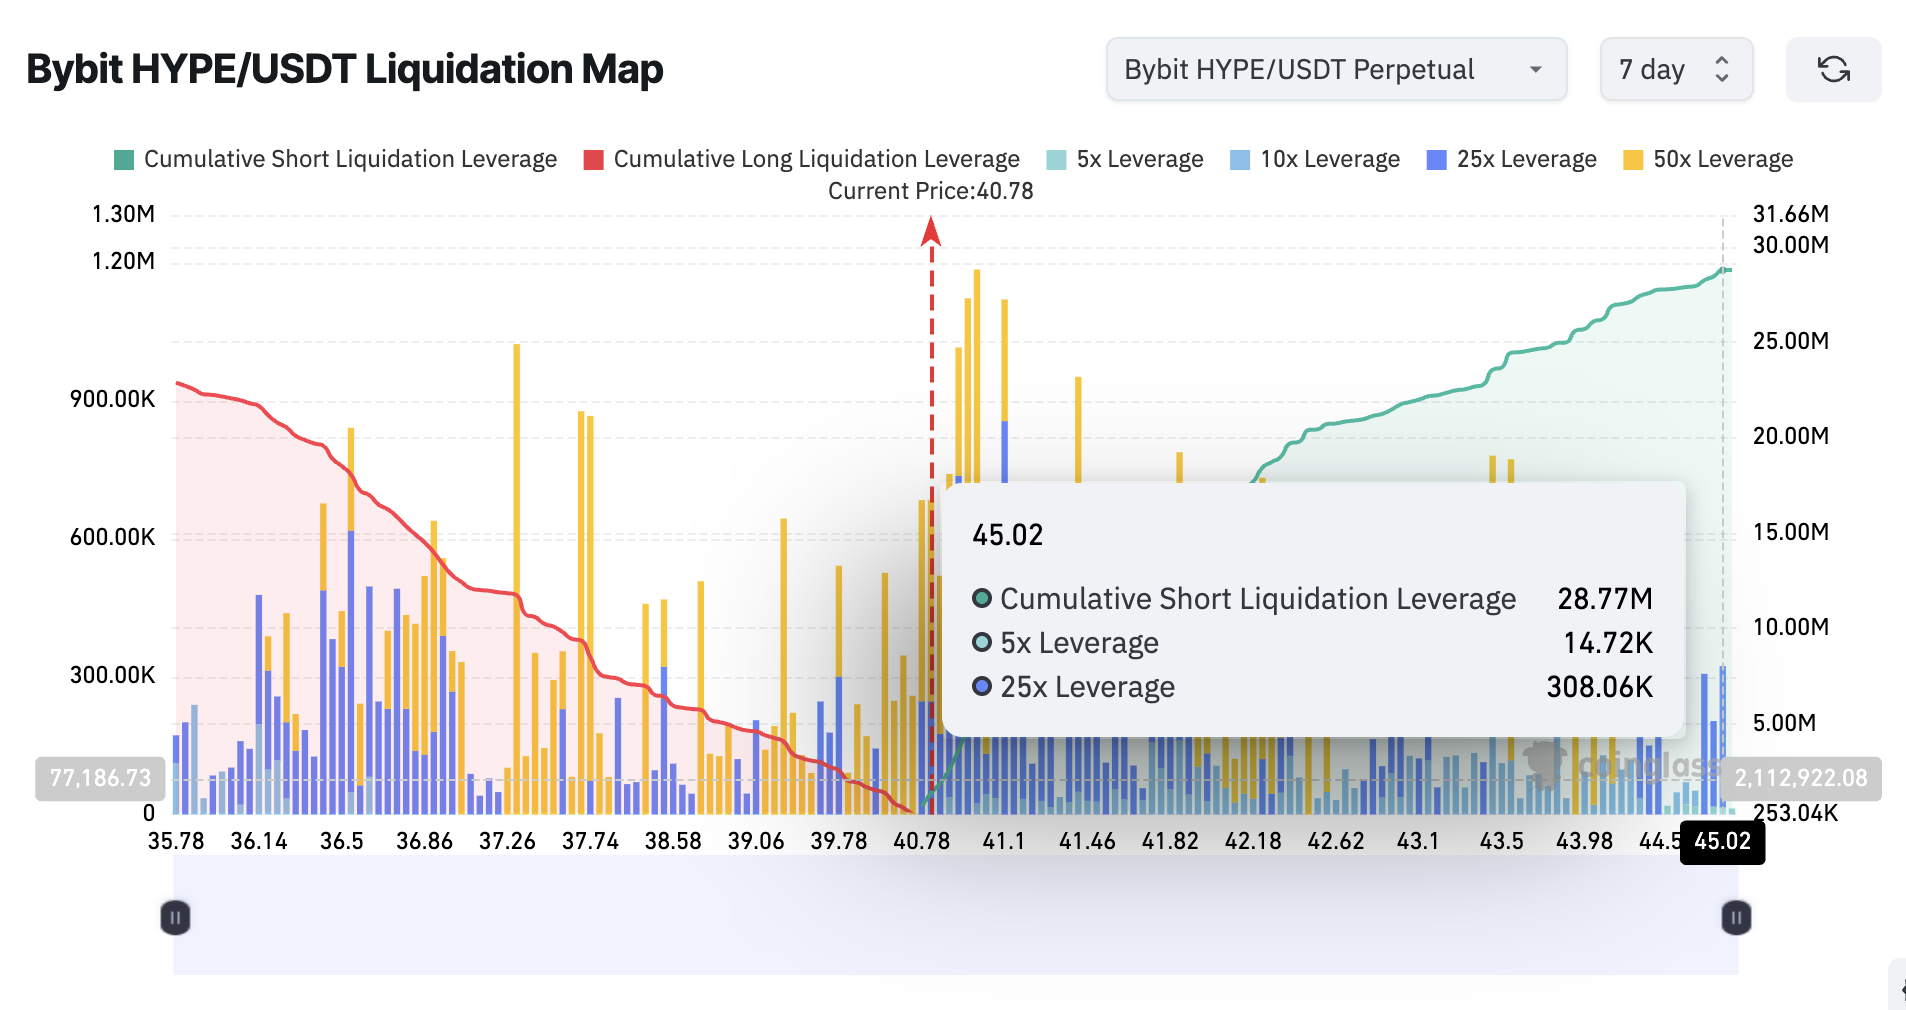 HYPE Liquidation Map: Coinglass
With spot flows flipping bullish and shorts piling up, the daily chart’s latest RSI signal could be the catalyst that tips the balance.
HYPE Price Forecast and the $48 Hurdle
Between September 25, 2025, and March 23, 2026 (a more recent pattern), the HYPE price has printed a lower low while the RSI has formed a higher low. That standard bullish divergence often precedes significant bounces, and it directly counters the hidden bearish divergence that triggered the pullback.
The two signals paint a clear picture. The hidden bearish divergence caused a short-term correction after the breakout target was nearly met. Now, the standard bullish divergence suggests the correction may already be ending, and a fresh leg higher could be forming.
The HYPE price bounce already started post the divergence flashed.
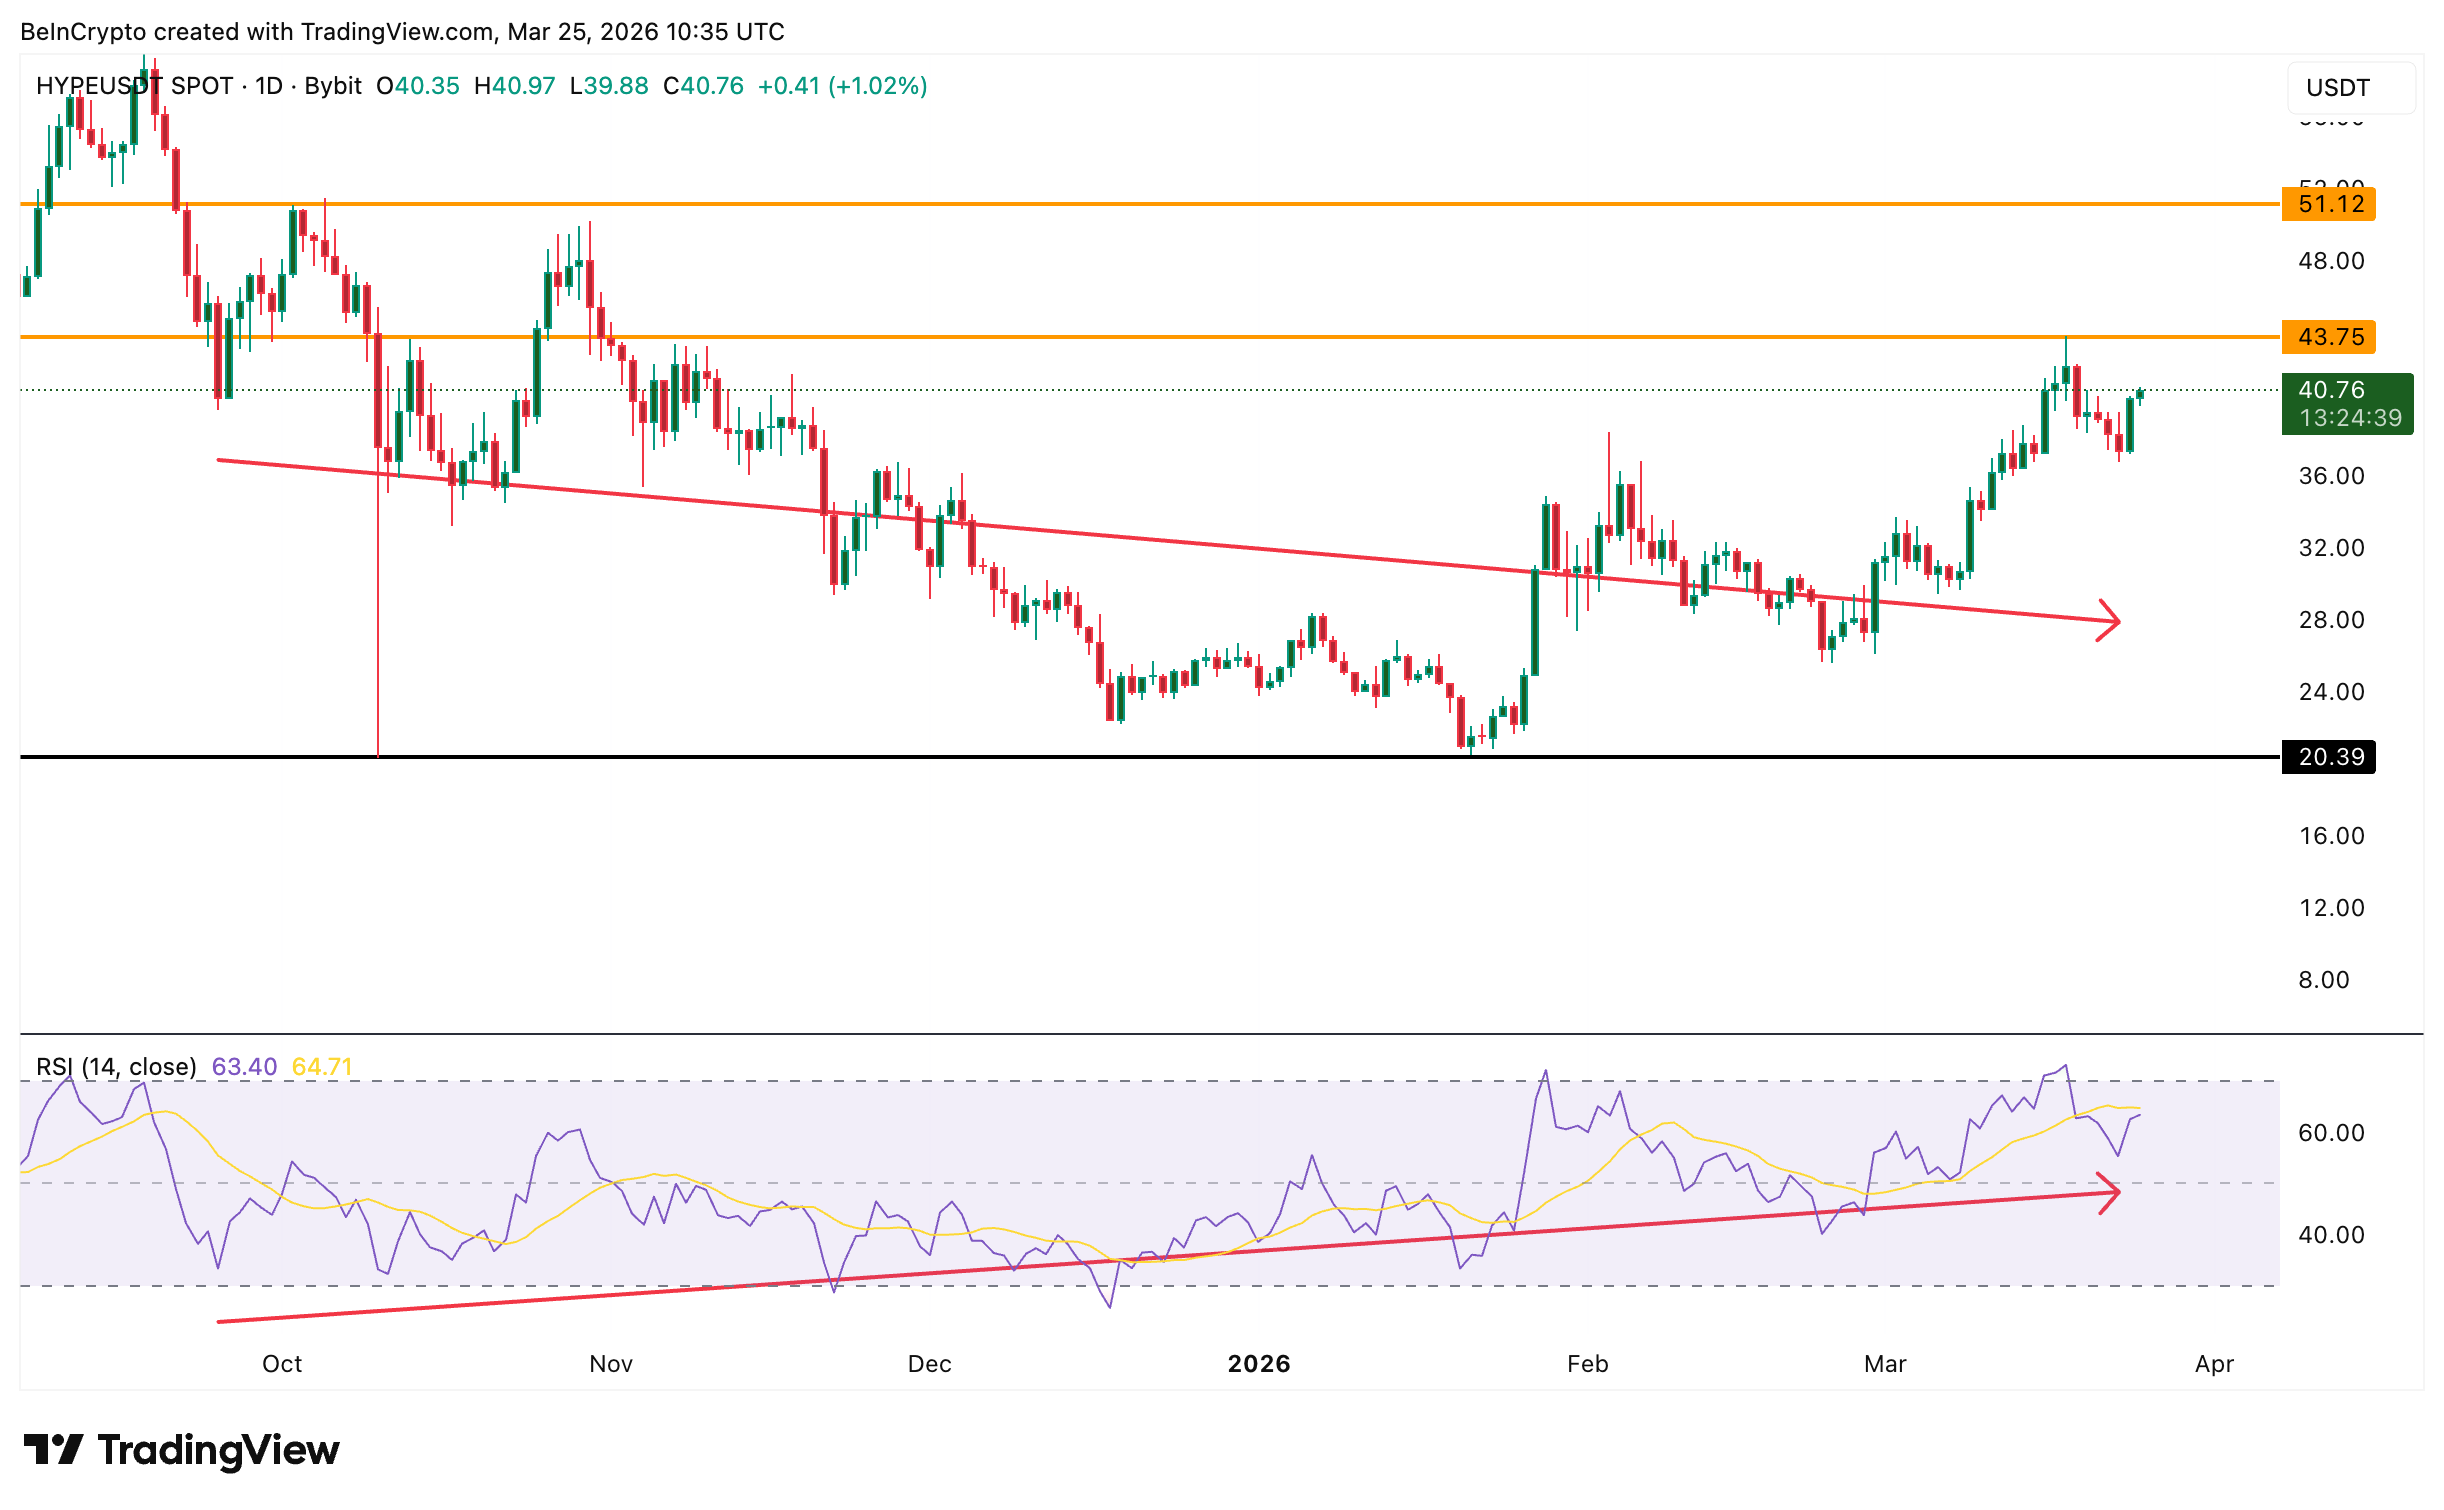 RSI Bullish Divergence: TradingView
For that to play out, HYPE needs a clean daily close above $41. The next resistance sits at $43, which aligns with the previous breakout target and a key horizontal level. Above that, $48 becomes the critical hurdle as it aligns with the 0.618 Fibonacci extension.
If $48 breaks with spot buyers sustaining the pressure and shorts getting squeezed, the path opens toward $51, $54, and eventually $66 at the 1.618 extension. Reaching $66 would set a new all-time high for Hyperliquid.
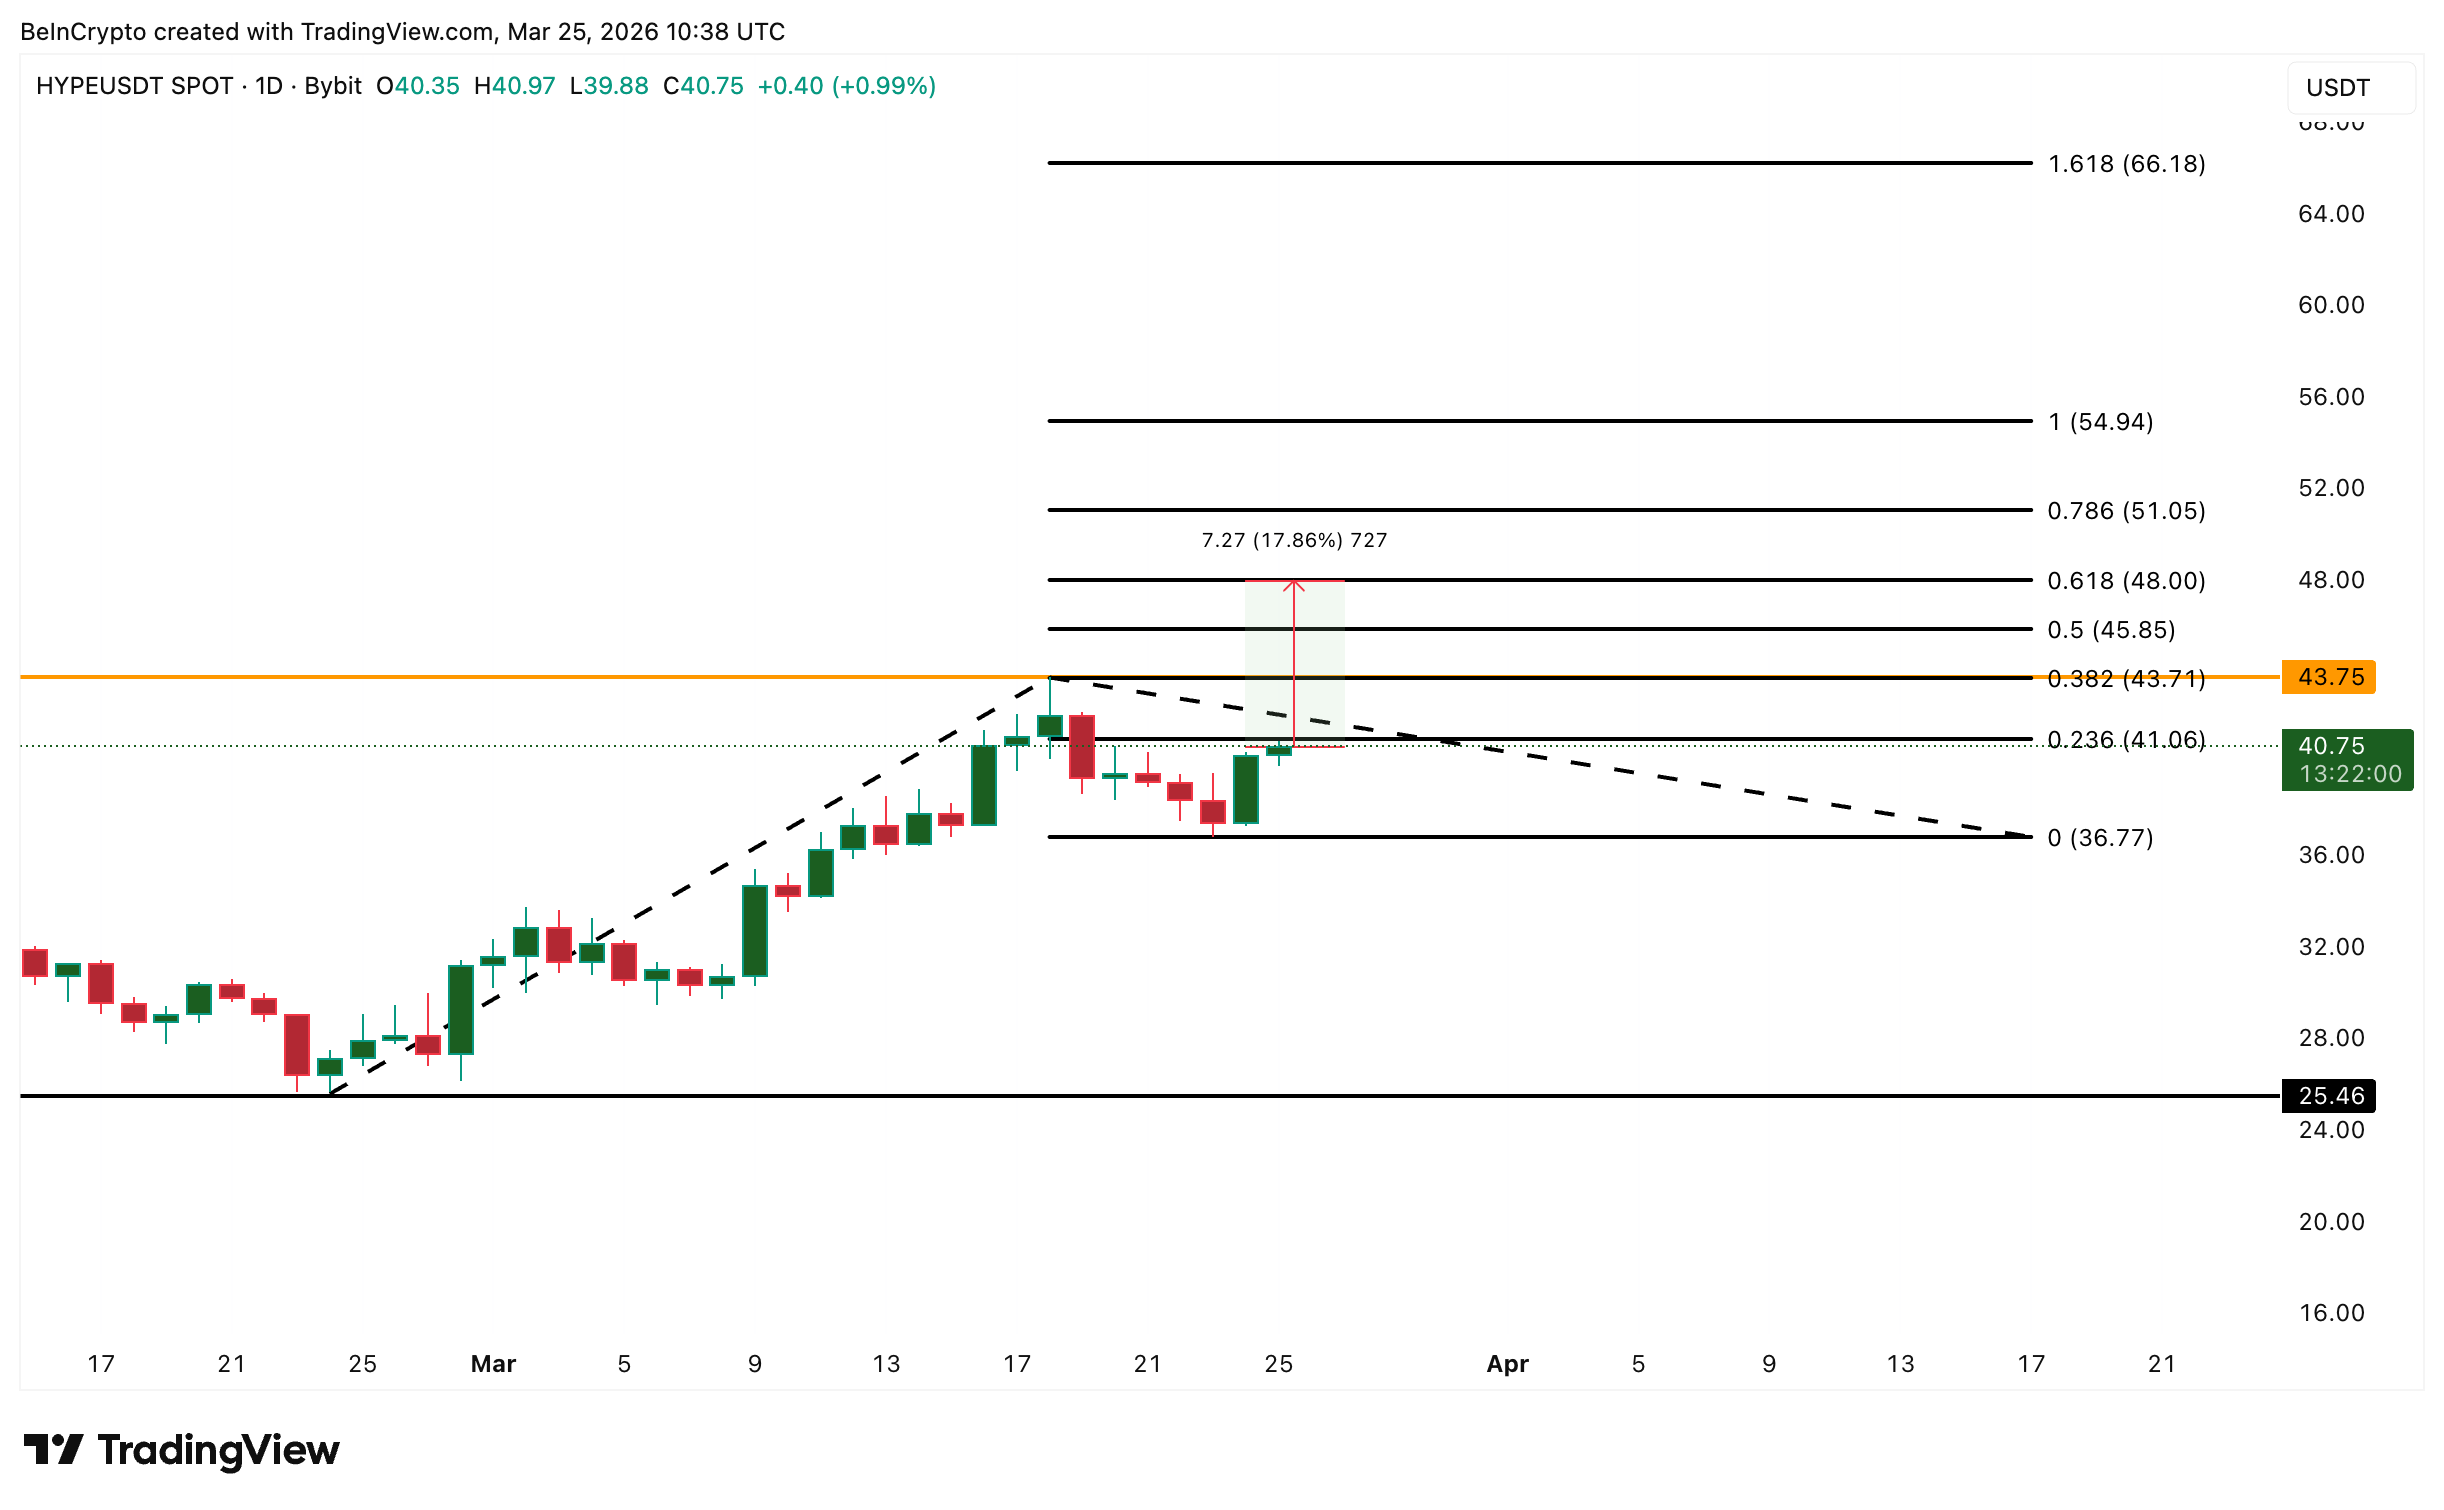 HYPE Price Analysis: TradingView
On the downside, a failure to hold $36 would invalidate the bullish divergence and push HYPE toward the $25 support zone. For now, $48 separates a short squeeze rally toward a new all-time high from a deeper pullback to $37.
0
0


 Manage all your crypto, NFT and DeFi from one place
Securely connect the portfolio you’re using to start.


0
0
