Why Is The Crypto Market Up Today?

0
0

The total crypto market cap (TOTAL) is flashing green on March 21, drawing attention from traders who have been watching a weeks-long consolidation pattern. After a stretch of indecision across major assets, price action is shifting in a way that has historically preceded larger moves.
In the news today:-
- The Senate stablecoin bill gained momentum after Senators Tillis and Alsobrooks reached a White House-backed agreement on yield language, potentially breaking a months-long deadlock. The deal would prohibit yield payments on passive stablecoin balances, clearing a key obstacle for the CLARITY Act in the Senate Banking Committee.
- Nevada became the first US state to force prediction market platform Kalshi to suspend all operations, after a court issued a 14-day restraining order requiring the company to obtain gaming licenses before resuming activity. The move adds to Kalshi’s mounting legal troubles, as the company continues to maintain that its prediction markets are financial instruments rather than illegal gambling.
The Crypto Market Attempts To Find Support
The total crypto market cap is standing at $2.4 trillion on the daily chart, up $20 billion over the last 24 hours. TOTAL has stabilized at the $2.37 trillion support level after a three-session pullback from the $2.54 trillion high reached on March 16. The $2.45 trillion horizontal level overhead capped the most recent recovery attempt on March 20.
TOTAL, which fell from $2.54 trillion to $2.37 trillion after the sharp pullback, signals that buyers are defending the base. A reclaim of $2.45 trillion on a daily close reopens the path toward $2.50 trillion. This is the key horizontal resistance that rejected TOTAL on March 18.
Want more token insights like this? Sign up for Editor Harsh Notariya’s Daily Crypto Newsletter here.
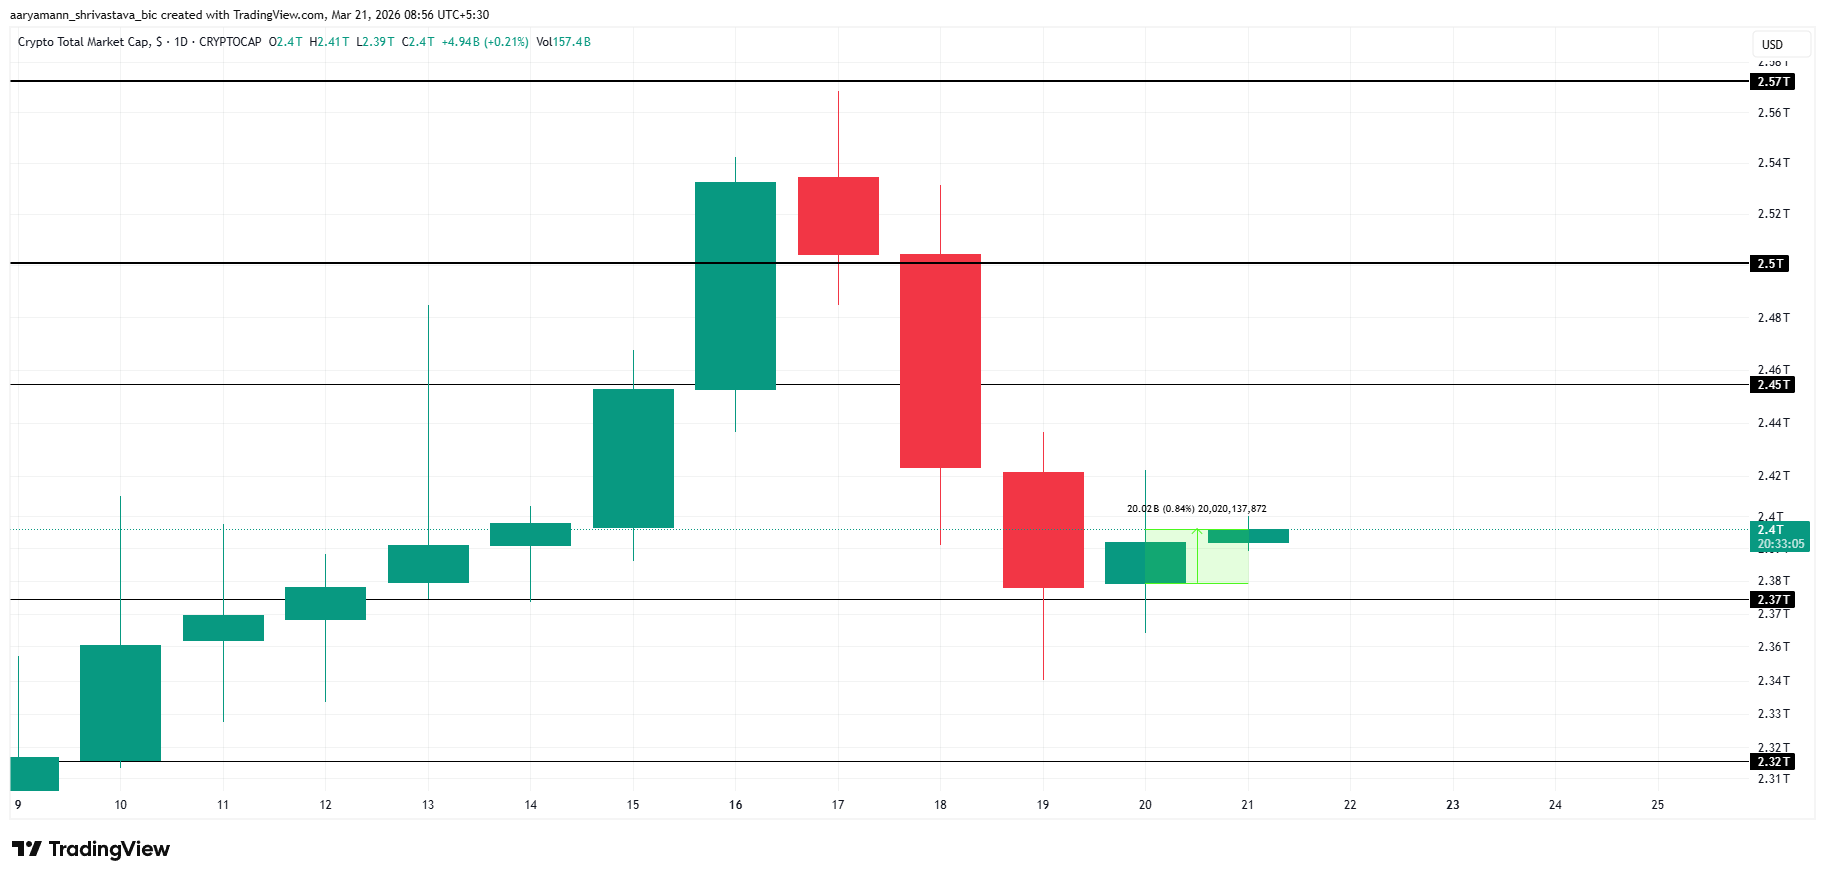 TOTAL Crypto Market Cap Analysis. Source: TradingView
A daily close below $2.37 trillion would invalidate the bullish read and expose $2.32 trillion, the horizontal support. Failure there removes the structure built through early March entirely. Holding $2.37 trillion on a closing basis is the single condition that keeps the recovery scenario viable heading into the weekend.
Bitcoin Is Maintaining Its Footing
Bitcoin (BTC) is trading at $70,717 on the daily chart, up 0.29% on the day. Price is holding just above the $70,553 support level, a horizontal line that has acted as a floor through mid-March. The Money Flow Index is at 75, elevated but below the prior session’s peak near 80.
The MFI holding above 70 while price reclaims $70,553 supports a bullish continuation toward $74,000. A sustained move above $74,000 opens the path to $75,851, the level BTC tagged on March 17 before pulling back. The $78,000 and $80,000 horizontal levels sit above as further targets if momentum holds.
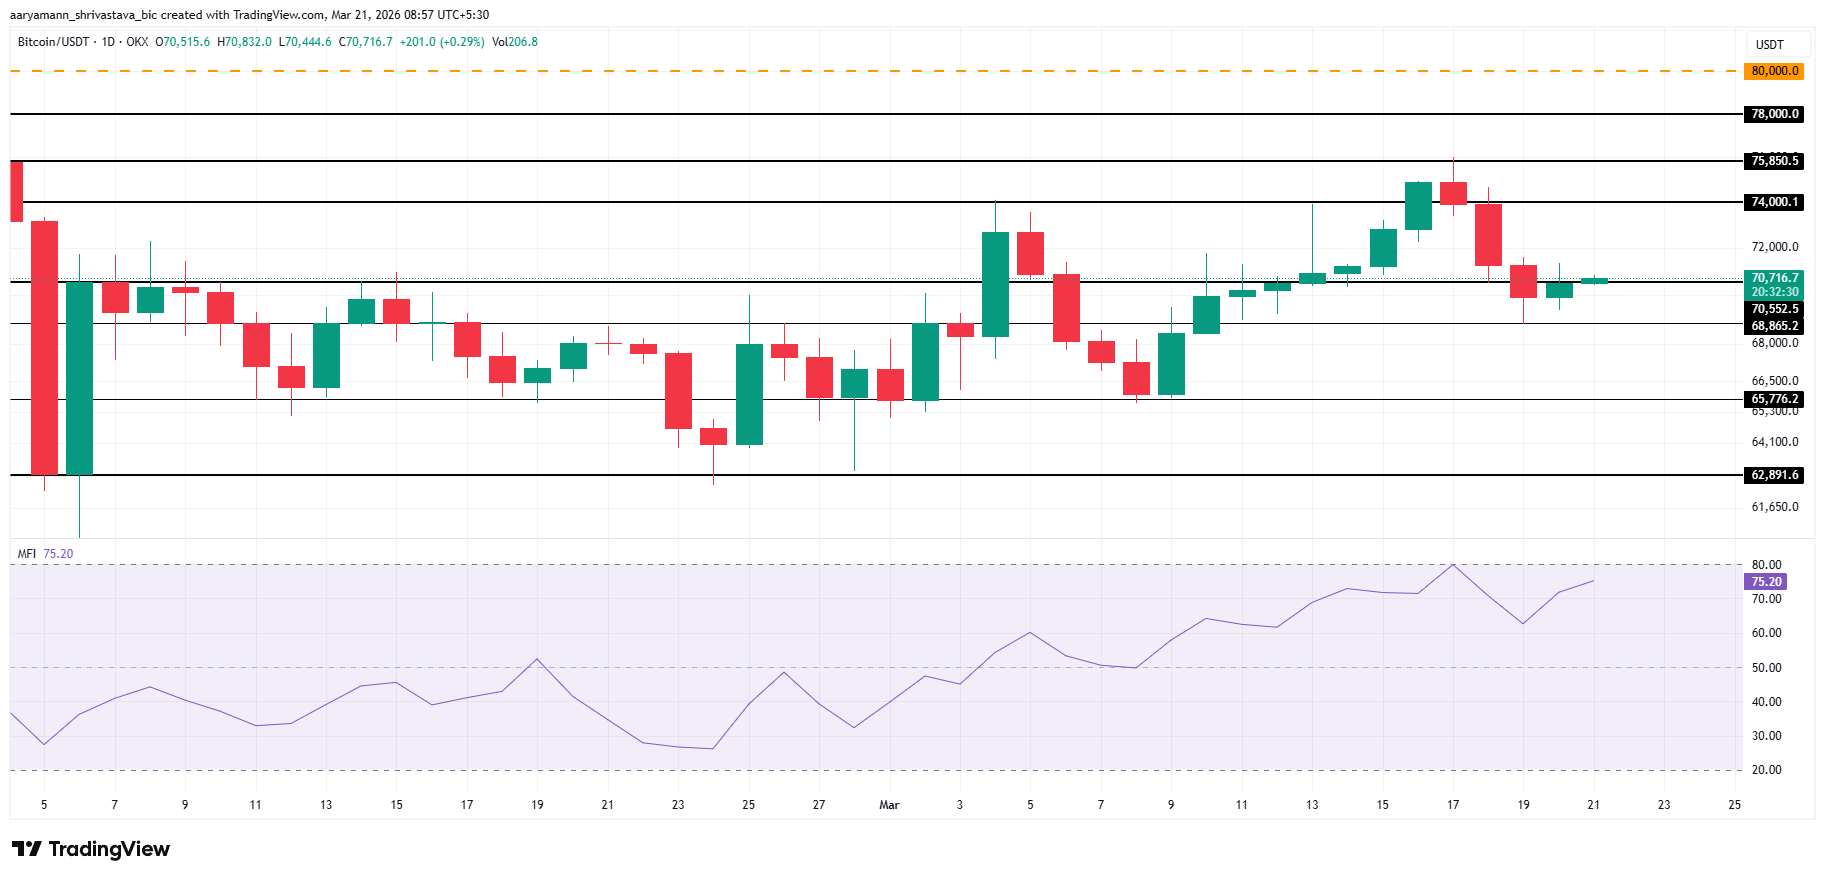 Bitcoin Price Analysis. Source: TradingView
A daily close below $70,553 would invalidate the bullish structure. This would expose BTC to $68,865, the next support floor visible on the chart. Failure there shifts focus to $65,776, where BTC found a base during the February sell-off. Holding $70,553 on any intraday dip remains the condition that keeps the recovery thesis intact.
Pi Coin Takes The Lead
Pi Coin price is trading at $0.20, up 12.42% today. Price is consolidating at the 0.618 Fibonacci level at $0.20, with Pi Coin posting a 12.25% gain. This is pushing PI back toward the upper channel boundary and invalidating the bearish outcome.
PI bouncing off the 0.618 level at $0.20 within the rising channel supports a move toward the 0.786 Fibonacci level at $0.22. A close above that level targets the 1.0 extension at $0.24, which marked the prior swing high on March 6.
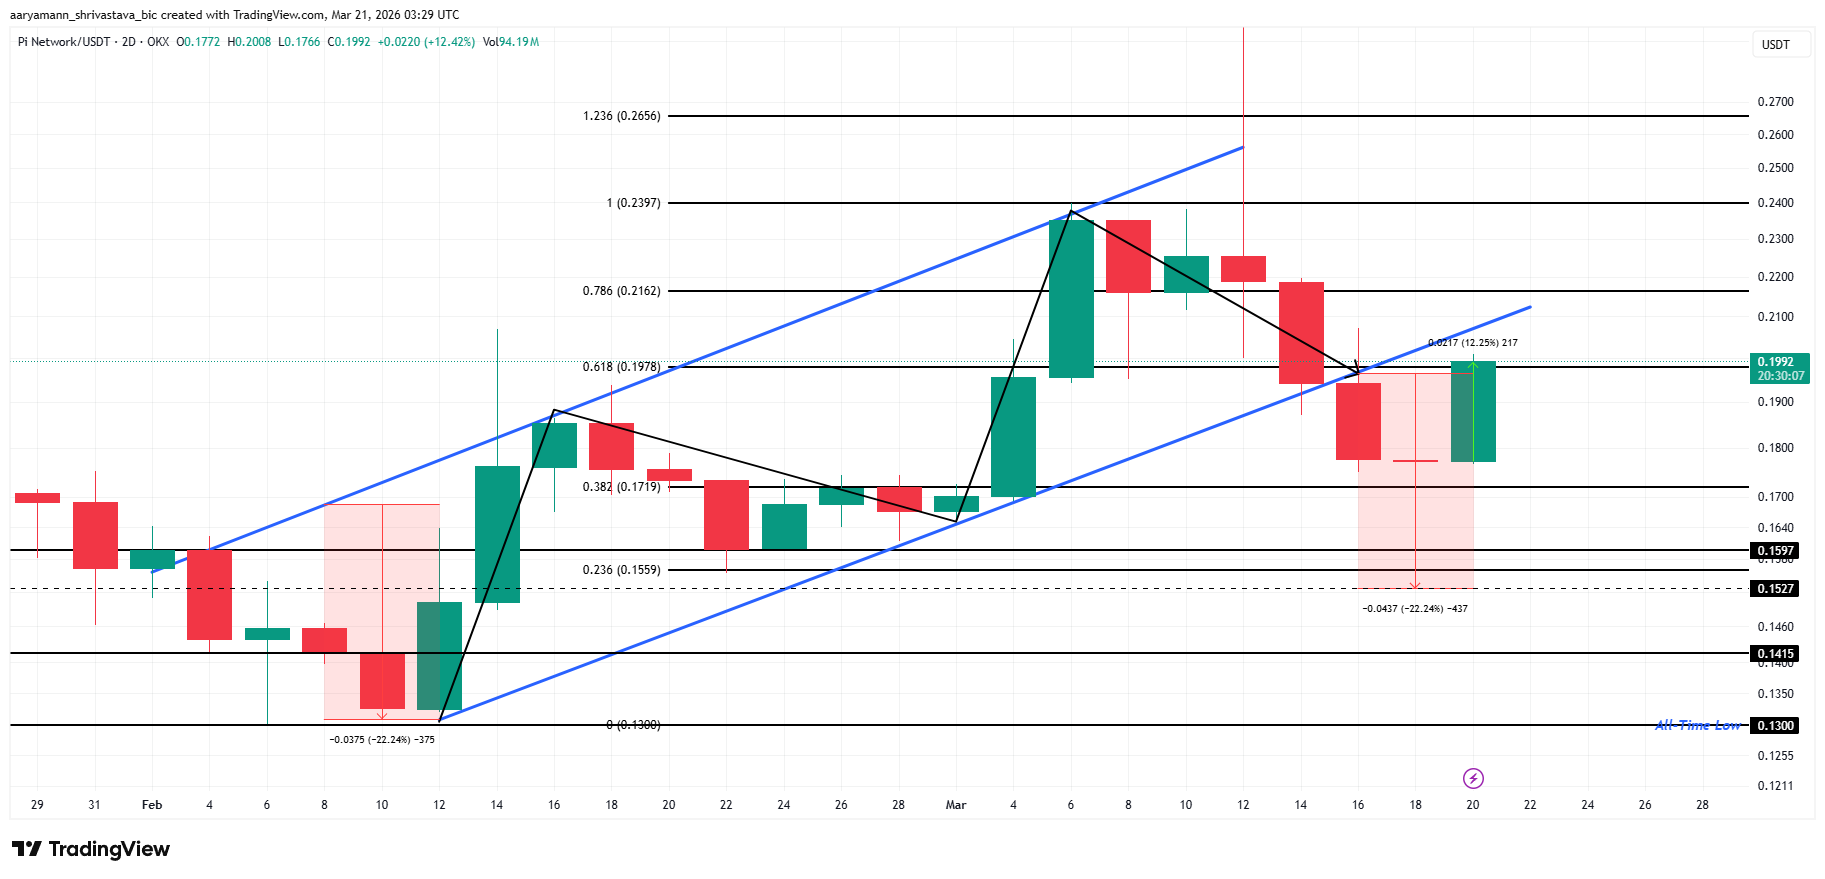 Pi Coin Price Analysis. Source: TradingView
A break below the 0.618 level at $0.20 and a close under $0.16 would invalidate the bullish thesis. That scenario exposes $0.15, the next annotated horizontal floor visible on the chart, followed by $0.14. The all-time low at $0.13 sits at the base and represents the worst-case support if sellers reclaim control.
0
0


 Manage all your crypto, NFT and DeFi from one place
Securely connect the portfolio you’re using to start.


0
0

0
0

0
0