As meme coins gradually regain strength, is PEPE preparing to bounce back above $0.000010 and recover to $0.000013?
As the altcoin market recovers overnight, meme coins are gradually gaining momentum. The frog-themed meme coin, PEPE, has risen by 1.67% over the past 24 hours.
Although it is still trading below the $0.000010 psychological level, the short-term recovery suggests a potential comeback for PEPE.
PEPE Price Analysis Reveals a Critical Crossroads
On the daily chart, PEPE's price action shows a significant reversal, reflecting strong bearish pressure. After breaking down from a falling wedge pattern, PEPE’s price has formed a triangle pattern.
PEPE Price Chart
In conjunction with the wedge breakdown, this creates a bearish pennant on the daily chart. PEPE has seen a short-term intraday recovery of 1.46%, currently trading at $0.0000094816.
The intraday recovery suggests the formation of a potential morning star pattern, which could test the overhead trendline near the $0.000010 psychological level.
However, the increasing bearish pressure has led to multiple sell signals. A bearish crossover between the 50-day and 200-day EMA lines has resulted in a death cross, which is typically seen as a signal for continued bearish momentum.
Additionally, the pennant formation on the daily chart is a continuation pattern, further increasing the chances of a breakdown. Since the start of 2025, PEPE has experienced a 52% decline.
Analyst Insight Reveals Crucial Support Levels
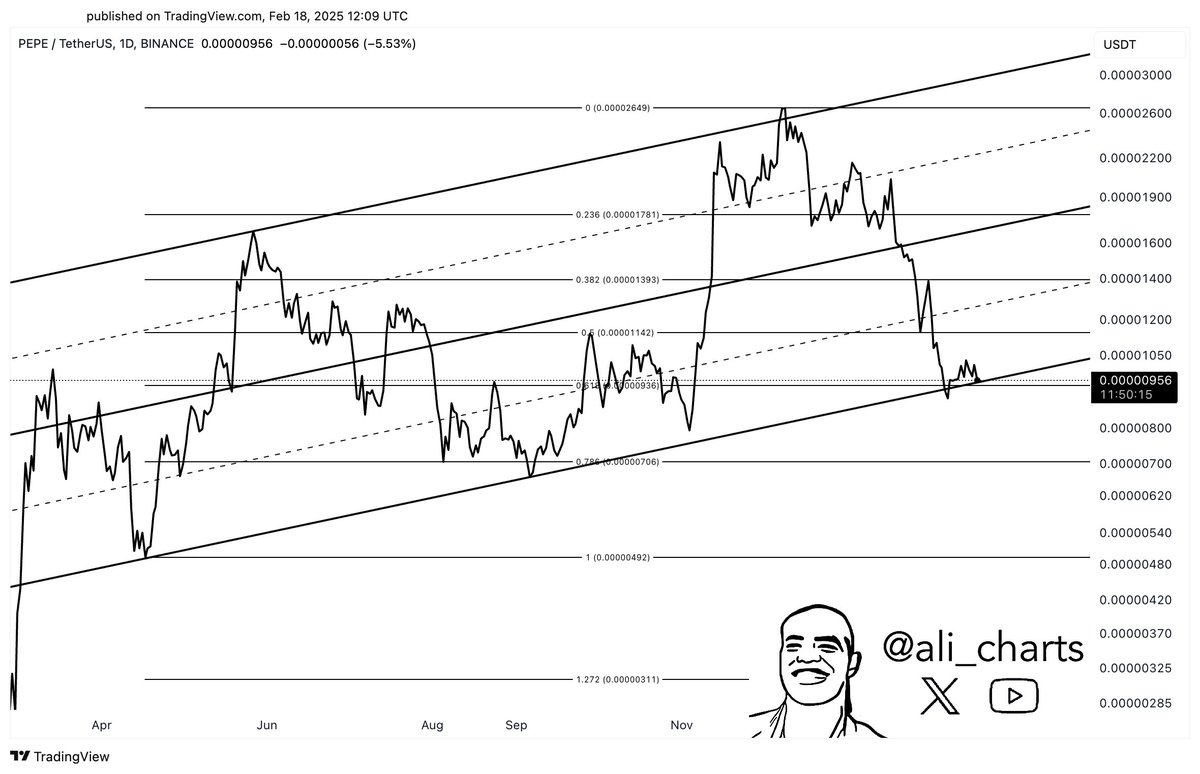
In a recent X post, Ali Martinez highlighted the importance of the $0.0000092 support level. He noted that a rising channel pattern is forming on the daily chart and predicted a sharp decline to $0.0000031 if PEPE closes below $0.0000092.
This critical support level aligns closely with the 67.80% Fibonacci level on his chart. However, the bearish target might be too aggressive, as two key support levels exist at $0.00000706 and $0.00000492.
PEPE Price Targets
Based on Fibonacci levels, a potential recovery to test the local resistance trendline could trigger a breakout rally. If such a scenario plays out, PEPE could test the 50-day EMA line near the 50% Fibonacci level at $0.0000132674.
On the flip side, a bearish breakdown could push PEPE to test the $0.0000066378 support level.


 PEPE Price Targets
Based on Fibonacci levels, a potential recovery to test the local resistance trendline could trigger a breakout rally. If such a scenario plays out, PEPE could test the 50-day EMA line near the 50% Fibonacci level at $0.0000132674.
On the flip side, a bearish breakdown could push PEPE to test the $0.0000066378 support level.
PEPE Price Targets
Based on Fibonacci levels, a potential recovery to test the local resistance trendline could trigger a breakout rally. If such a scenario plays out, PEPE could test the 50-day EMA line near the 50% Fibonacci level at $0.0000132674.
On the flip side, a bearish breakdown could push PEPE to test the $0.0000066378 support level.


 Manage all your crypto, NFT and DeFi from one place


