Are Active Addresses Raising Concerns for TRX? Could TRX Price Drop by 50%?

0
0

The post Are Active Addresses Raising Concerns for TRX? Could TRX Price Drop by 50%? appeared first on Coinpedia Fintech News
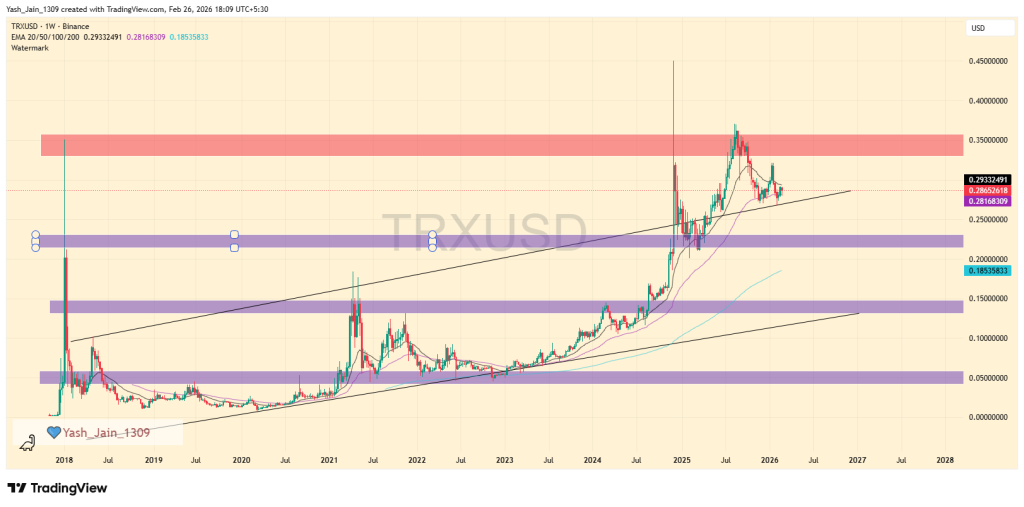
The TRX price topped out at $0.3695 in Q3 2025 and that’s where the music stopped. Since then, momentum hasn’t just cooled, it’s stalled. The $0.3339–$0.3500 range has quietly turned into a major brick wall, turning sellers back into control.
That zone isn’t random noise on the TRX price chart. It’s become the dominant supply area, and rejections spree from it are already unfolding. At current levels near $0.2864, TRX/USD is stuck beneath a ceiling it hasn’t been able to crack.
And when rally pushed back from that pressure its generally a top and that’s rarely a bullish tell.
Long-Term Channel Back in Focus
Now here’s where things get technical. TRX broke out of a long-term ascending channel in 2025 which was a bullish development at the time. But markets have a sense of humor. That former breakout level, the upper border of the channel, is now being tested as support.
If it holds, structure survives. If it breaks, TRX price re-enters the channel.
And that’s where the downside math starts getting uncomfortable. A confirmed slip below that wedge support opens the path toward $0.2215. Lose that, and $0.1354 becomes the logical endpoint of a broader correction phase. From $0.2864, that’s roughly a 50% haircut.
So when traders talk about a bearish TRX price prediction, this is what they’re looking at this structure, not emotion.
Utility Fueled the Rally
But price doesn’t move in a vacuum. The previous rally wasn’t built on hype alone. It was driven by increased USDT activity on the network. More stablecoin transfers meant higher blockchain utility, which meant more active addresses.
In February, active addresses peaked at 5.60 million. They’ve since dipped to 4.74 million. The decline isn’t dramatic or big. In fact, the broader multi-year rising trend in active addresses is still intact. It’s been tested several times and hasn’t broken.
Still, here’s the uncomfortable truth: the more a trendline is tested, the more fragile it becomes.
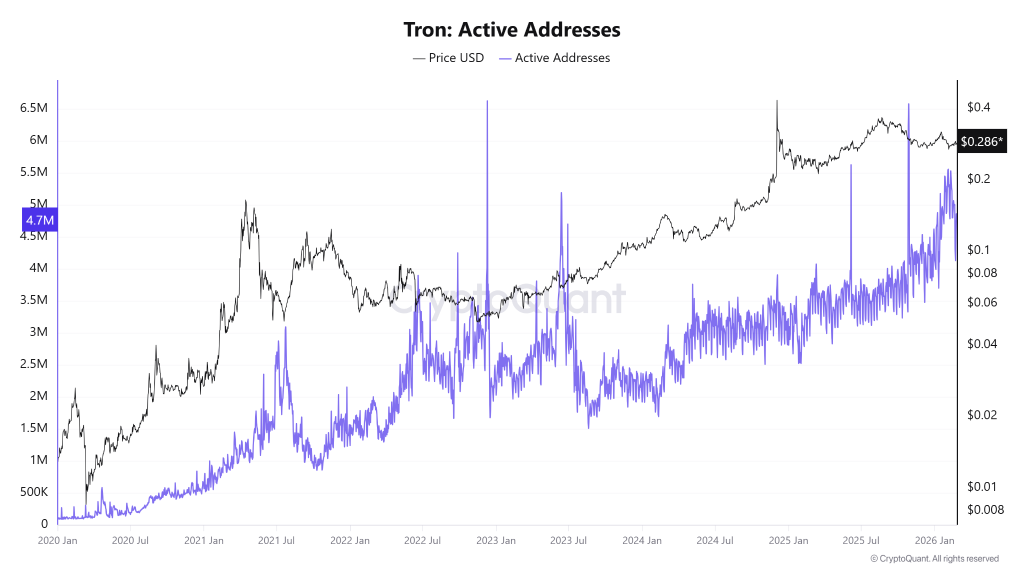
The 4 Million Line in Sand
Q1 2026 could mark another retest of that rising active address trend. If the metric breaks down decisively, especially below the psychological 4 million level it suggests declining network utility.
And that could have serious consequences. As stablecoin plays a big part, if Lower stablecoin transfer activity is materialized that means reduced liquidity. Reduced liquidity tends to hit price. Hard.
So what’s next? Everything hinges on support both on the TRX price chart and in active addresses. If both crack, a full correction toward $0.2215 and even $0.1354 isn’t far-fetched.
At this point, the TRX price isn’t crashing. But it’s standing on a trapdoor.
0
0

 Manage all your crypto, NFT and DeFi from one place
Securely connect the portfolio you’re using to start.


0
0

0
0