Bitcoin Holds Above $63K Weekly Close as RSI Divergence Signals Possible Bottom

0
0
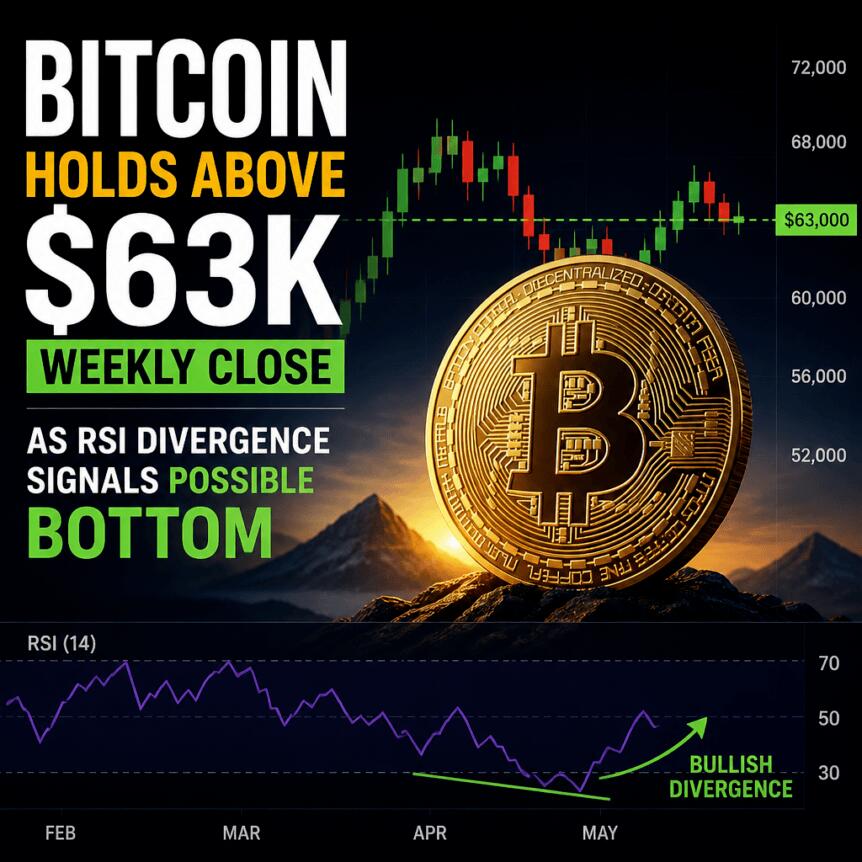
Bitcoin is showing signs of stabilization after putting in a new 2026 low around $59,000 and then maintaining a weekly close above $63,000 for three straight weeks. Market observers say this behavior resembles earlier bottom-building phases, where BTC trades within a defined range for weeks before a more sustained trend develops.
That technical picture is being supported by derivatives and spot ETF flow data. Bitcoin futures open interest has dropped 19.5% from its June peak, funding rates have cooled to about 0.02% (from roughly 0.1%), and spot Bitcoin ETF outflows have slowed dramatically—falling to about $540 million over the past two weeks from $5.5 billion in the prior month.
Key takeaways
- Weekly closes above $63,000 have held for three weeks after a 2026 low near $59,000, suggesting range-building rather than immediate breakdown.
- Bitcoin futures open interest fell 19.5% from its early-June peak, indicating reduced leverage and position unwinds.
- Funding rates have cooled sharply, dropping to around 0.02% from about 0.1%, which points to less aggressive long positioning.
- Spot Bitcoin ETF selling pressure has eased, with outflows of roughly $540 million over two weeks compared with $5.5 billion earlier.
- Long-term holder supply metrics indicate maturation, while “sales pressure” has remained inactive for 1,256 consecutive days.
Weekly structure looks like earlier “bottom-building” behavior
According to the technical pattern described in the source analysis, Bitcoin’s recent weekly price action echoes setups that have appeared multiple times since 2023. The general theme in those periods: after a local bottom is put in place, BTC often trades near that zone for an extended stretch, and only later transitions into a clearer uptrend.
The article notes one notable exception in November 2025, when Bitcoin spent roughly 10 weeks moving sideways above $88,000 before falling back toward the $60,000 area. In contrast to that breakdown scenario, the current setup is characterized by repeated weekly closes above $63,000, which keeps price from testing—at least for now—the recent low near $59,000.
The comparison also draws on the late-2022 to early-2023 period. During that timeframe, the weekly relative strength index (RSI) moved through oversold conditions, then recovered. BTC later printed a lower low while RSI formed a higher low, creating a bullish divergence. The source frames that divergence as a turning point that preceded Bitcoin’s broader 2023 uptrend.
In the present case, the focus is again on the $63,000 region, where the same analyst argument is that a positive RSI divergence is forming. If this holds, the implication is not that the market has confirmed a full reversal yet, but that BTC may be building a base—trading between support and resistance rather than accelerating lower.
Derivatives cooling suggests leverage is being removed, not added
Beyond price charts, the derivatives data points to a market that is less crowded than it was in early June. Funding rates across exchanges have fallen to around 0.02% from roughly 0.1% at the start of June, a move that typically signals that the market is paying less to maintain leveraged long exposure.
The source attributes additional context to CryptoQuant analyst Woominkyuu, who noted that total Bitcoin open interest across exchanges peaked at $25.96 billion on June 1 and dropped to $20.89 billion by June 21. That represents a 19.5% decline in open interest, which the analysis says exceeded the 11.4% price drop over the same interval.
This relationship matters because open interest usually reflects how much leverage is embedded in outstanding derivatives positions. When price and open interest both decline, it often suggests that traders are closing positions or being forced out via liquidations—rather than new leveraged positions building up at current levels. In other words, the source argues that signs of excess leverage appear to be fading, and there is limited evidence (based on these metrics alone) of aggressive new short positioning at the current price range.
ETF flow data shows selling pressure has eased
Spot Bitcoin ETF flows provide a separate lens on demand and selling intensity. The source cites SoSoValue data showing about $5.5 billion leaving spot ETFs between May 15 and June 11. Importantly, it then narrows to the most recent period: over the past two weeks, outflows total roughly $540 million, indicating a sharp slowdown in sell pressure.
For market participants, this shift can be significant. ETF outflows are often interpreted as a proxy for broader spot selling, including systematic reallocations by traditional investors. A slowdown doesn’t automatically imply net buying, but it reduces the urgency of persistent spot absorption from the market’s side, which can help prices stabilize—especially when derivatives leverage is also cooling at the same time.
That combination—less leverage in futures alongside easing spot ETF outflows—fits the broader thesis that BTC is not only holding key support, but also losing some of the “forced selling” dynamics that can accelerate drawdowns.
On-chain signals point to supply maturation and absent capitulation
The source also brings in on-chain evidence from Bitcoin research analyst Axel Adler Jr. It states that long-term holder (LTH) realized supply has recently reached 12.42 million BTC, a level associated with supply maturation and coins moving into stronger hands. In practical terms for investors, LTH behavior is often watched as a proxy for whether earlier holders are distributing supply or whether they are holding through volatility.
At the same time, the source highlights that a Bitcoin sales pressure metric has stayed inactive for 1,256 consecutive days—described as the longest stretch on record. While on-chain metrics can never guarantee near-term price direction, the claim here is that extended inactivity in “sales pressure” aligns with the idea that Bitcoin may be stabilizing near a cycle low.
Taken together, the on-chain picture in the article is “mixed but constructive”: supply maturation appears to be progressing while forced selling conditions remain absent. When paired with the cooling derivatives landscape and reduced ETF outflows, the overall message is that BTC may be transitioning from a high-stress selling phase into something closer to consolidation.
Traders and long-term investors will likely watch whether Bitcoin can hold weekly support near $63,000 as futures positioning continues to unwind and spot ETF flows remain subdued. The next signals to monitor are whether open interest stops falling and whether ETF outflows stabilize into a net-neutral or net-positive pattern—changes that would help confirm that a base is actually forming rather than merely delaying the next move.
This article was originally published as Bitcoin Holds Above $63K Weekly Close as RSI Divergence Signals Possible Bottom on Crypto Breaking News – your trusted source for crypto news, Bitcoin news, and blockchain updates.
0
0

 Manage all your crypto, NFT and DeFi from one place
Securely connect the portfolio you’re using to start.

0
0


0
0
