Binance Coin (BNB) Faces Potential Drop as Price Nears Key Moving Averages

0
0

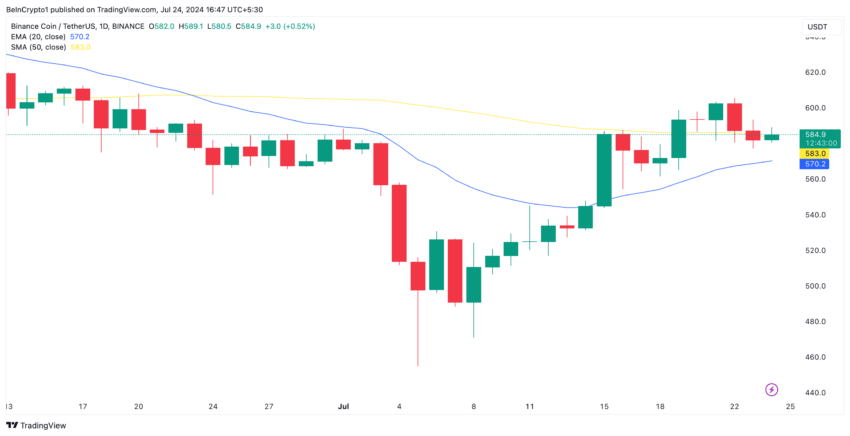
Binance Coin (BNB) is currently trading at its 50-day Simple Moving Average (SMA). At press time, the coin’s price is in a downtrend, and it appears to be heading towards its 20-day Exponential Moving Average (EMA).
A breakdown below these key levels would signal a spike in selling activity and a decline in the demand for the altcoin.
Binance Coin Attempts To Fall Below Key Levels
An asset’s 50-day SMA is a technical indicator that calculates its average closing price over the past 50 days. The 20-day EMA, on the other hand, measures the average price of an asset over the past 20 trading days.
At press time, BNB trades around its 50-day SMA and is in a downtrend, attempting to fall below its 20-day EMA. When an asset’s price is set up this way, it suggests that its recent momentum is weaker compared to its longer-term trend.
It signals a potential trend reversal from bullish to bearish, and traders often interpret it as a sign to go short.
Read More: How to Buy BNB and Everything You Need to Know
 Binance Coin Analysis. Source: TradingView
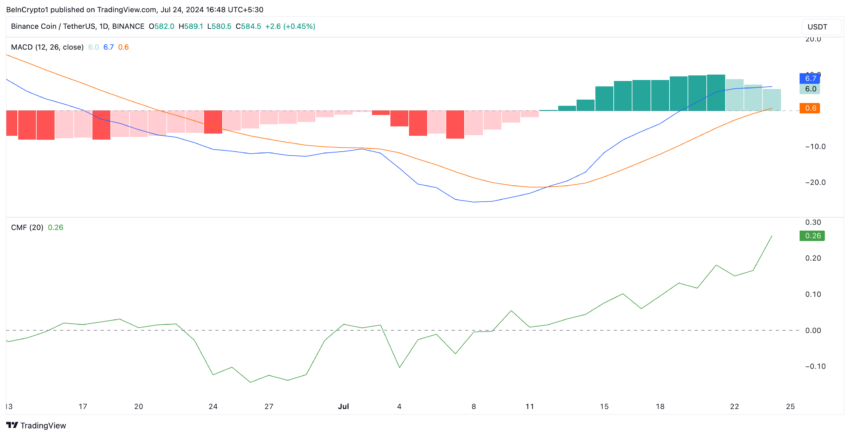
Although BNB is poised to shed some of its recent gains, the bulls remain in market control. Readings from its Moving average convergence/divergence (MACD) show that buying pressure continues to outweigh selling momentum among market participants. At press time, the coin’s MACD line (blue) rests above its signal (orange) and zero lines and is in an uptrend.
This indicator measures an asset’s price trend and identifies potential entry and exit points. When the MACD line rests above the signal and zero lines, it is bullish. This means the asset’s short-term momentum is stronger than the medium-term trend, hinting at a price rally.
Confirming the strength of the bullish bias toward BNB, its Chaikin Money Flow (CMF) is in an uptrend at 0.26.
 Binance Coin Analysis. Source: TradingView
This indicator measures the flow of money into and out of an asset. When its value is positive, it signals liquidity inflow into the market. This is a positive sign and hints at a possible price rally.
BNB Price Prediction: Market May Trend in Either Direction
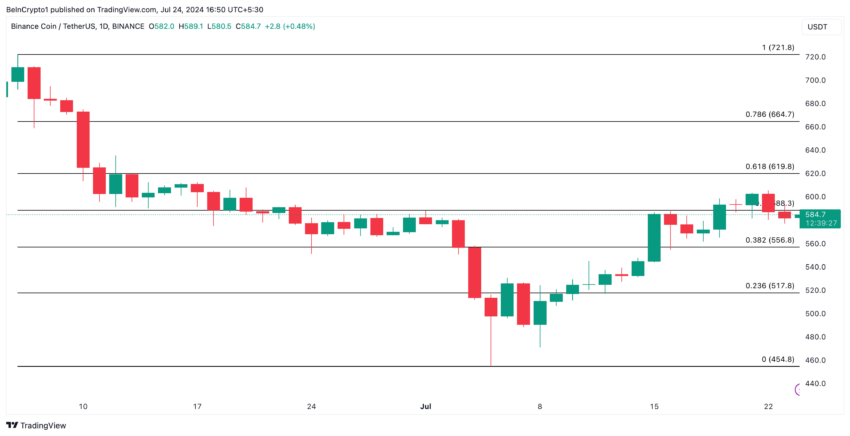
Readings from BNB’s MACD and CMF indicators indicate bullish momentum, suggesting that the asset’s price is likely to increase. However, the fact that its price is at the 50-day SMA and nearing the 20-day EMA suggests potential bearish pressure.
If the bearish signals from BNB’s moving averages override the bullish signals from its MACD and CMF, a price decline is likely. The coin’s value may drop to $556.
Read More: Binance Coin (BNB) Price Prediction 2024/2025/2030
 Binance Coin Analysis. Source: TradingView
However, if the bearish projections are invalidated, the coin’s price may climb above $600 to trade at $619.
0
0


 Manage all your crypto, NFT and DeFi from one place
Securely connect the portfolio you’re using to start.

0
0

0
0


0
0