Cardano’s Downward Spiral: Analyzing the Storm of Bearish Indicators
7h ago•

bullish:
0
bearish:
0
Share

- Cardano (ADA) experiences major price drop, reaching levels not seen since November 2023.
- Technical indicators and on-chain metrics suggest potential for further decline.
- Market structure and investor sentiment point towards bearish momentum in the short term.
Cardano (ADA) has found itself at the epicenter of a market-wide downturn, shattering hopes of an imminent bull run. The digital asset’s value has plummeted to $0.30, a price point not witnessed since the closing months of 2023.
Decoding Cardano’s In/Out of Money Around Price (IOMAP) Metric
Delving into on-chain analytics, the IOMAP data paints a concerning picture for ADA’s immediate future. This sophisticated metric, which categorizes wallet addresses based on their profit and loss status at various price levels, reveals a troubling imbalance.
A substantial cluster of 106,850 addresses, holding 572.21 million ADA tokens, finds itself underwater at the $0.31 mark. In contrast, only 35,460 addresses, representing 451.95 million tokens, remain in the green between $0.28 and $0.30.
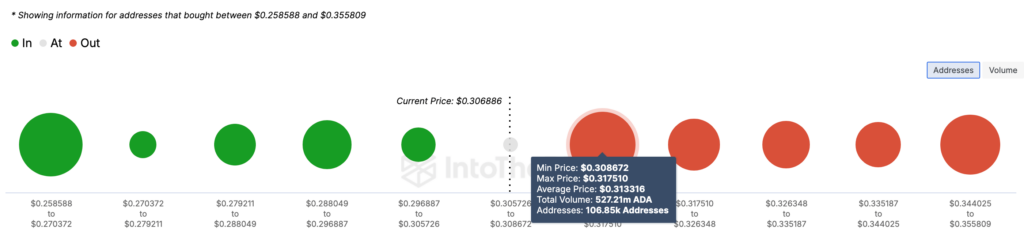
The disparity in address distribution highlighted by the IOMAP creates a precarious scenario for ADA’s price stability. The current support at $0.30 appears fragile, potentially buckling under the weight of sell pressure from loss-bearing investors eager to break even.
Should this support level crumble, Cardano could face a drop towards the $0.28 threshold, opening the floodgates for further bearish momentum.
Further compounding ADA’s woes, the Market Value to Realized Value (MVRV) Long/Short Difference indicator flashes a warning sign. Currently registering at -10.79%, this metric suggests that short-term holders are outperforming their long-term counterparts in profit realization.
Historical data indicates that a reading approaching -19.33% often coincides with the onset of a bear market, placing ADA perilously close to this critical juncture.
A confluence of technical indicators on Cardano’s daily chart shows the bearish narrative. The Supertrend indicator, a versatile tool for identifying price direction and generating trading signals, has positioned itself above ADA’s price since it traded at $0.42. This configuration typically heralds a sell signal, foreshadowing the recent price collapse.
7h ago•
bullish:
0
bearish:
0
Share


 Manage all your crypto, NFT and DeFi from one place
Securely connect the portfolio you’re using to start.

bullish:
0
bearish:
0

bullish:
1
bearish:
0

bullish:
1
bearish:
0

bullish:
1
bearish:
0