
Pons Price Prediction: Can PONS Hold Its Breakout After 73% Weekly Run

0
0

July 21, 2026, based on Uniswap/Robinhood Chain charts and cross-checked exchange listings. PONS is a thinly traded, newly launched token; treat every figure below as a moving target, not a fixed fact.
Something shifted in the Pons market today, and traders noticed before the charts even caught up.
Pons Price Prediction Today: What's Driving $PONS Buzz?
Every so often, a token shows up looking like it woke up with something to prove, and that's the mood behind today's Pons price prediction conversation.
There's a certain kind of morning in crypto where nobody's talking about the same old names.
Today, it's Pons.
Something in the community feels different, less like routine chatter and more like people are actually paying attention for a reason.
Maybe it's the timing. Maybe it's what's happening behind the scenes with the project itself.
Whatever it is, the usual quiet has broken, and traders who weren't watching $PONS last week suddenly are.
We're not here to bury the lede in charts and jargon right out of the gate.
First, it's worth understanding why this token found itself in the spotlight at all.
There's a story building underneath the surface, and it's not the kind that gets explained in one line.
So what actually changed for Pons, and is there enough behind it to matter?
Key Takeaways
-
Direction: Short-term momentum is bullish. $PONS is inside an ascending channel on the hourly chart with RSI at 65.62, not yet overbought.
-
Why: A steep weekly candle (+73% week over week) plus an active token-burn program are doing the heavy lifting, not just broad market flow.
-
Short-term range: Roughly $0.025-$0.030 support/resistance band on the hourly chart, with $0.0364 as the next real ceiling if momentum holds.
-
Invalidation: A close back below the ascending channel's lower trendline (near $0.0158 EMA) would undo the bullish setup.
It jumped 73% in a week. That's the Easy Part to Explain.
The harder question is whether Pons can hold onto that move or whether this is just another thin-liquidity token riding a broader altcoin market rally before it fades.
$PONS spent most of its short life climbing a slow diagonal, then broke out hard around July 19-21. Some of that is straightforward: buyers showed up, sellers didn't push back hard enough, and the chart did what charts do when demand outpaces supply for a few days straight.
But there's a wrinkle here that's worth sitting with before you look at a single price target.
Is a token that's barely a few weeks old, trading almost entirely on one decentralized exchange, actually showing you real price discovery? Or is thin liquidity just making normal-sized trades look like conviction?
Coin Overview
| Field | Detail |
|---|---|
| Name / Ticker | Pons / PONS |
| Chain | Robinhood Chain (EVM-compatible) |
| Contract | 0x39dBED3a2bd333467115dE45665cC57F813C4571 |
| Type | ERC-20, launchpad/utility token |
| Total Supply | 1,000,000,000 PONS (fixed at launch; deflationary via burns) |
| Primary Market | PONS/WETH on Uniswap V3/V4 (Robinhood) |
| Holders | About 10,262 (per block explorer; may lag real-time) |
| Liquidity (Pool) | Roughly $1.0M |
| TVL | Roughly $798K |
Pons itself is a token launchpad on Robinhood Chain; it lets people create and discover fixed-supply tokens, and $PONS is the platform's own token. The holder and contract data above are cross-checked against the token's block explorer record.
According to the project's docs, all WETH fees collected from token launches on the platform get funneled into $PONS buybacks, and $PONS transaction fees are burned outright. That's a real deflationary mechanic, not marketing fluff, but it's also a mechanic that depends entirely on the launchpad staying busy. If launch volume dries up, so does the buyback pressure. It's the kind of setup worth comparing against other crypto price predictions before drawing conclusions.
Why Prices Look Different Depending on Where You Look
Here's the thing: pull up $PONS on three different trackers and you'll get three different prices. CoinGecko has shown it near $0.019; a Uniswap dashboard snapshot put it at $0.0293; and another aggregator showed roughly $0.01 the same day. That's not a data error; it's what happens with a token that's mostly trading in one pool with about a million dollars of liquidity.
Big swings between snapshots are normal here. And that's exactly why a single "the price is X" headline number is less useful for $PONS than it would be for something like Ethereum's price outlook or Solana's bullish setup.
For this piece, we're anchoring to the live PONS/WETH pool chart on Uniswap, since that's the primary market.
Technical Analysis (1H and 1W charts)
On the 1-hour chart, $PONS has been climbing inside a well-defined ascending channel since around July 17. The 50-period EMA (a moving average that smooths out short-term noise) sits near $0.01983, well below the current price, which is generally a healthy sign; it means the recent move hasn't gotten too far ahead of the underlying trend.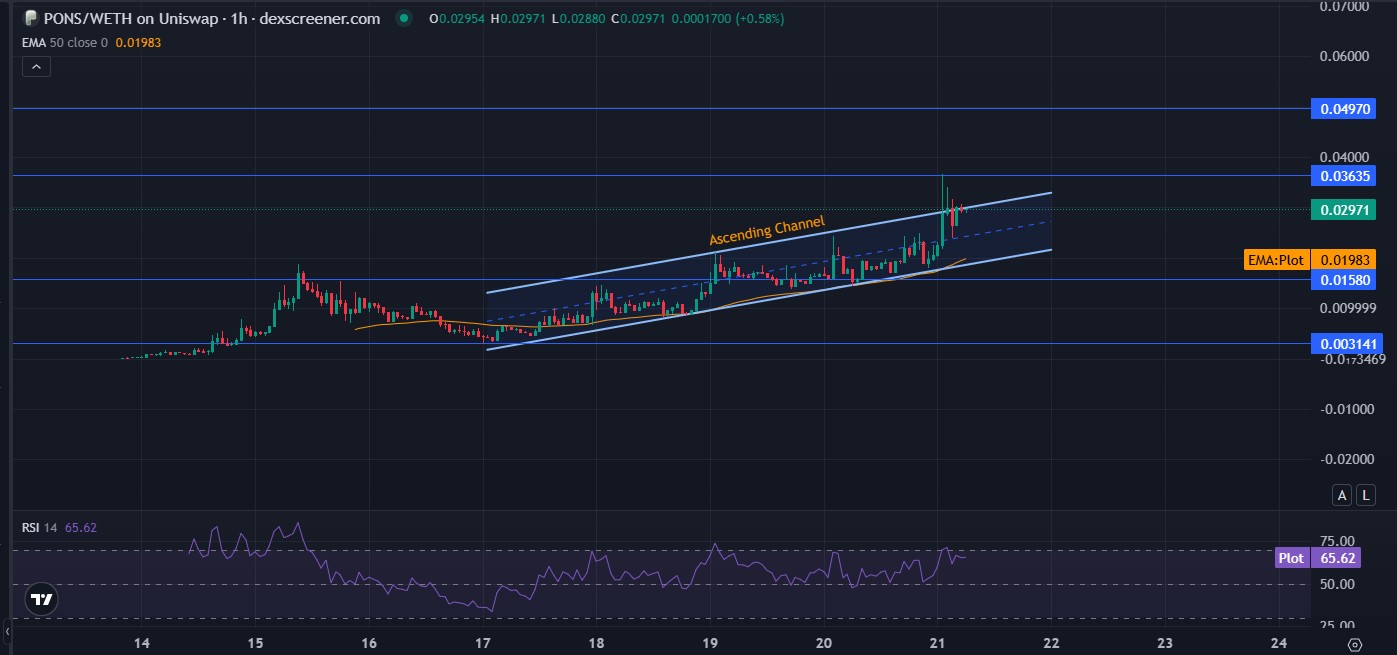
RSI (Relative Strength Index, a momentum gauge from 0 to 100, where above 70 usually signals overbought) reads 65.62. Strong, but not extended.
On the weekly chart, the two most recent candles tell a cleaner story. 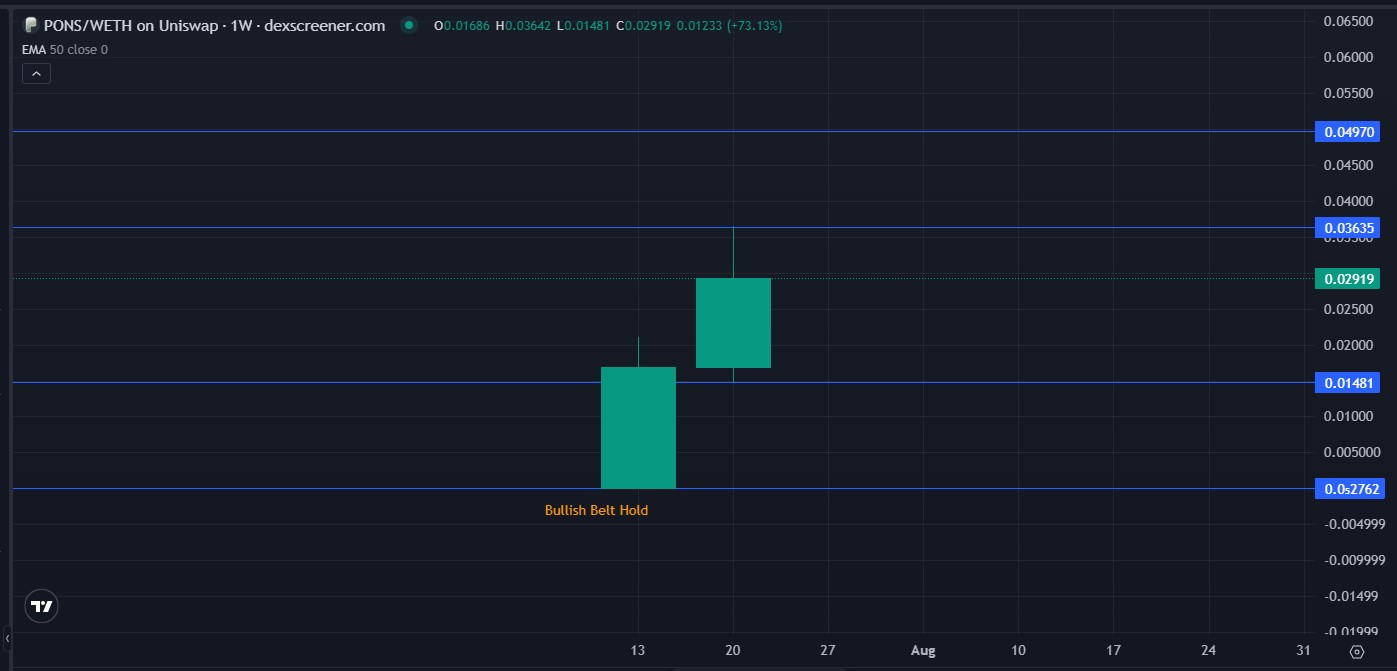
A "Bullish Belt Hold" pattern (a candle that opens near its low and closes strong, often marking the start of a new upward push) shows on the chart around the week of July 13, followed by a follow-through green candle into July 20 with a +73.13% weekly change.
Key levels worth watching:
-
Immediate support: About $0.0158
-
Immediate resistance: About $0.0364, the next visible supply zone above current price
-
Hard invalidation for the bullish setup: a decisive close back under the channel's lower boundary
We'd note one thing that stood out when we compared the two charts: the weekly candle's high ($0.0364) lines up almost exactly with the resistance zone marked on the hourly chart. That kind of alignment across timeframes tends to matter more than a level that only shows up on one chart.
On-Chain and Trading Activity
Trading is active but two-sided. Over 24 hours, the pool showed roughly 12,481 transactions split close to evenly between buys and sells, with buy volume slightly ahead of sell volume ($4.4M vs $4.1M), figures that line up with the liquidity and volume stats on PONS's Uniswap token page.
But the top-trader leaderboard tells a less balanced story. Looking at the 30-day window, several of the largest wallets show sold amounts far exceeding what they bought, some by 100x or more, with unrealized PNL in the hundreds of thousands. That pattern (buy small, sell large, repeat) is typical of either early insiders or bots working the pool rather than organic retail accumulation. It doesn't mean the token is a scam. It does mean a chunk of the volume you're seeing may be professional traders cycling the same liquidity, not new buyers coming in.
That distinction matters if you're trying to judge whether current volume reflects genuine demand or just active recirculation of the same coins.
The Burn Is Real, But It's Not the Whole Story
The project's official account posted on X that 20% of PONS supply was burned in eight days, with the treasury continuing to accumulate PONS from platform revenue. Turns out, that's a meaningfully aggressive burn rate for a token this young, and it puts PONS in the same conversation as other protocols running active buyback and burn programs.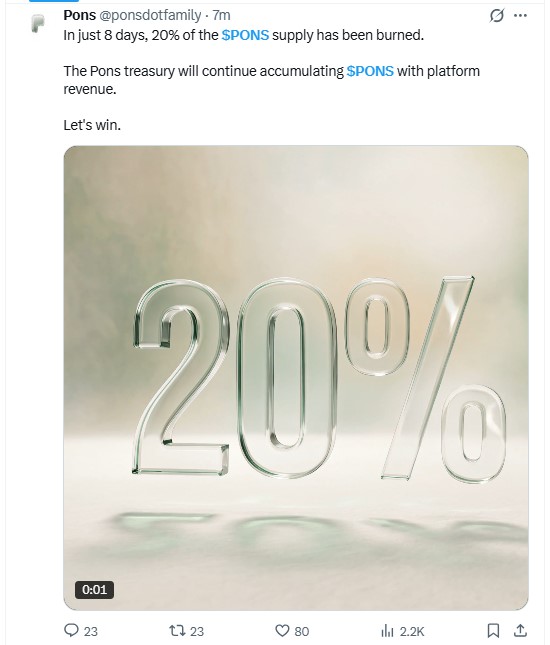
It's a genuine deflationary pressure on supply. But it's also entirely tied to launchpad activity. New tokens getting created and traded on Pons is what generates the WETH fees that fund the buyback-and-burn loop. If that activity slows, either from regulatory friction, a broader crypto pullback, or just novelty wearing off, the burn rate slows with it. This is the project-specific risk that matters more here than for most tokens: PONS's deflationary story is a derivative of platform usage, not a fixed monetary policy.
Scenarios (Speculative, Not Guaranteed)
| Scenario | What would need to happen | Rough range | Timeframe | What breaks it |
|---|---|---|---|---|
| Bull case | Channel holds, launchpad volume and burns keep accelerating, resistance at $0.0364 breaks with volume | $0.035-$0.050 | 2-6 weeks | Failure to close above $0.0364 on rising volume |
| Base case | Price chops between current support/resistance while the market digests the recent run | $0.018-$0.030 | 1-4 weeks | This is the "nothing decisive happens" case |
| Bear case | Launchpad activity slows, top-wallet selling accelerates, channel breaks | $0.010-$0.0158 | 1-3 weeks | Weekly close back below the 50 EMA |
These are directional ranges based on the chart structure and burn mechanics described above, not a formula-derived price target built the same way we'd frame a bull-bear base case for any major asset. A token this new, with this little liquidity and this short a price history, doesn't have enough data behind it for a long-term (multi-month or multi-year) forecast to mean much more than a guess. Treat anything claiming a precise long-term PONS price target with real skepticism.
Risks Worth Naming Directly
-
Liquidity risk: Roughly $1M in pool liquidity means a single large sell can move price sharply.
-
Concentration risk: top-trader data shows heavy activity from a small number of wallets.
-
Dependency risk: the burn/buyback mechanic relies entirely on continued launchpad usage.
-
Information risk: As a very new project, there's limited independent audit or long-track-record data to lean on.
-
No CEX depth (yet): it isn't trading on major centralized exchanges, which limits arbitrage and can widen price discrepancies between trackers.
-
Market-wide risk: a broader crypto market pullback tends to hit thin-liquidity tokens like PONS harder and faster than majors.
Disclaimer: This is market commentary based on publicly available charts and on-chain data, not financial advice. PONS is a low-liquidity, early-stage asset; price swings of 20% or more in a single day are realistic, not exceptional, for a token like this.
0
0
 Manage all your crypto, NFT and DeFi from one place
Securely connect the portfolio you’re using to start.