Why Is the US Stock Market Down Today?

0
0

The US stock market slipped on March 13 as investors reacted to a troubling mix of high inflation and slowing economic growth. Fresh data showed inflation rising again while GDP growth was revised sharply lower.
This combination is raising fears of stagflation, a scenario where prices remain high while the economy weakens. At the same time, rising oil prices and several major corporate developments added further uncertainty for investors.
Here are the key factors moving the market.
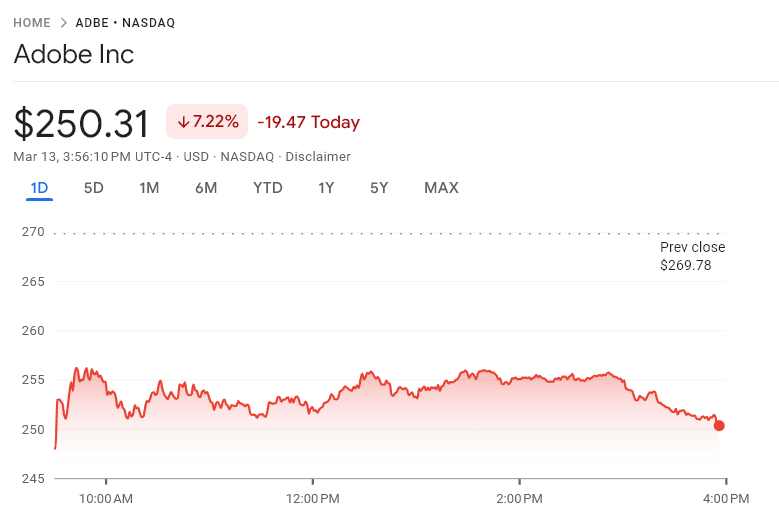 Adobe Stock Price Today. Source: Google Finance
Why Did the Stock Market Fall Today?
Two economic signals hit markets at the same time.
1. Inflation rose again
The Core PCE index, the Federal Reserve’s preferred inflation gauge, climbed to 3.1% year-over-year. Services and housing costs remain stubbornly high.
This makes it harder for the Fed to cut interest rates quickly.
2. Economic growth slowed sharply
US GDP was revised down to 0.7%, from an earlier estimate of 1.4%.
Lower spending from both consumers and businesses suggests the economy may be losing momentum.
When inflation stays high while growth slows, markets fear stagflation. This environment is historically difficult for stocks.
What Happened to Major US Indexes?
Markets ended the session slightly lower but broadly weak.
- NASDAQ: −0.92%
- Russell 2000: −0.53%
- Dow Jones: −0.06%
Technology stocks led the decline, while defensive sectors performed better.
Rising oil prices layer on further pressure, threatening to feed back into future inflation readings and squeeze consumer spending even more.
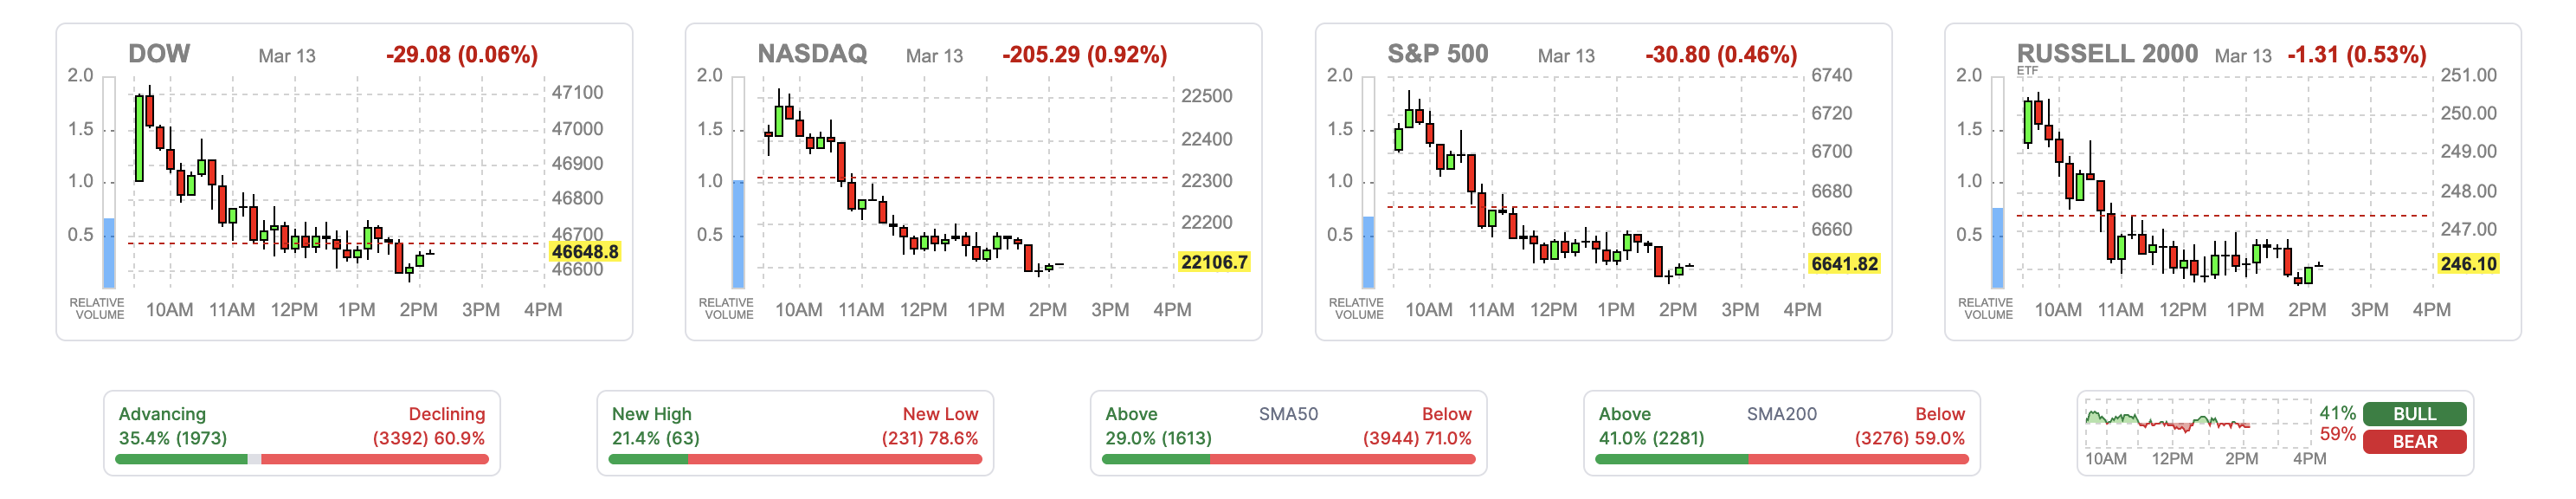 US Stock Market Screener: FinViz
Technically, the S&P 500 broke below 6,660 support and is testing 6,620, the 0.618 Fibonacci level.
Below that sits the 200-day EMA (Exponential Moving Average), a long-term trend-tracking indicator that smooths out daily price noise, currently near 6,590. A break below that opens the door to 6,480.
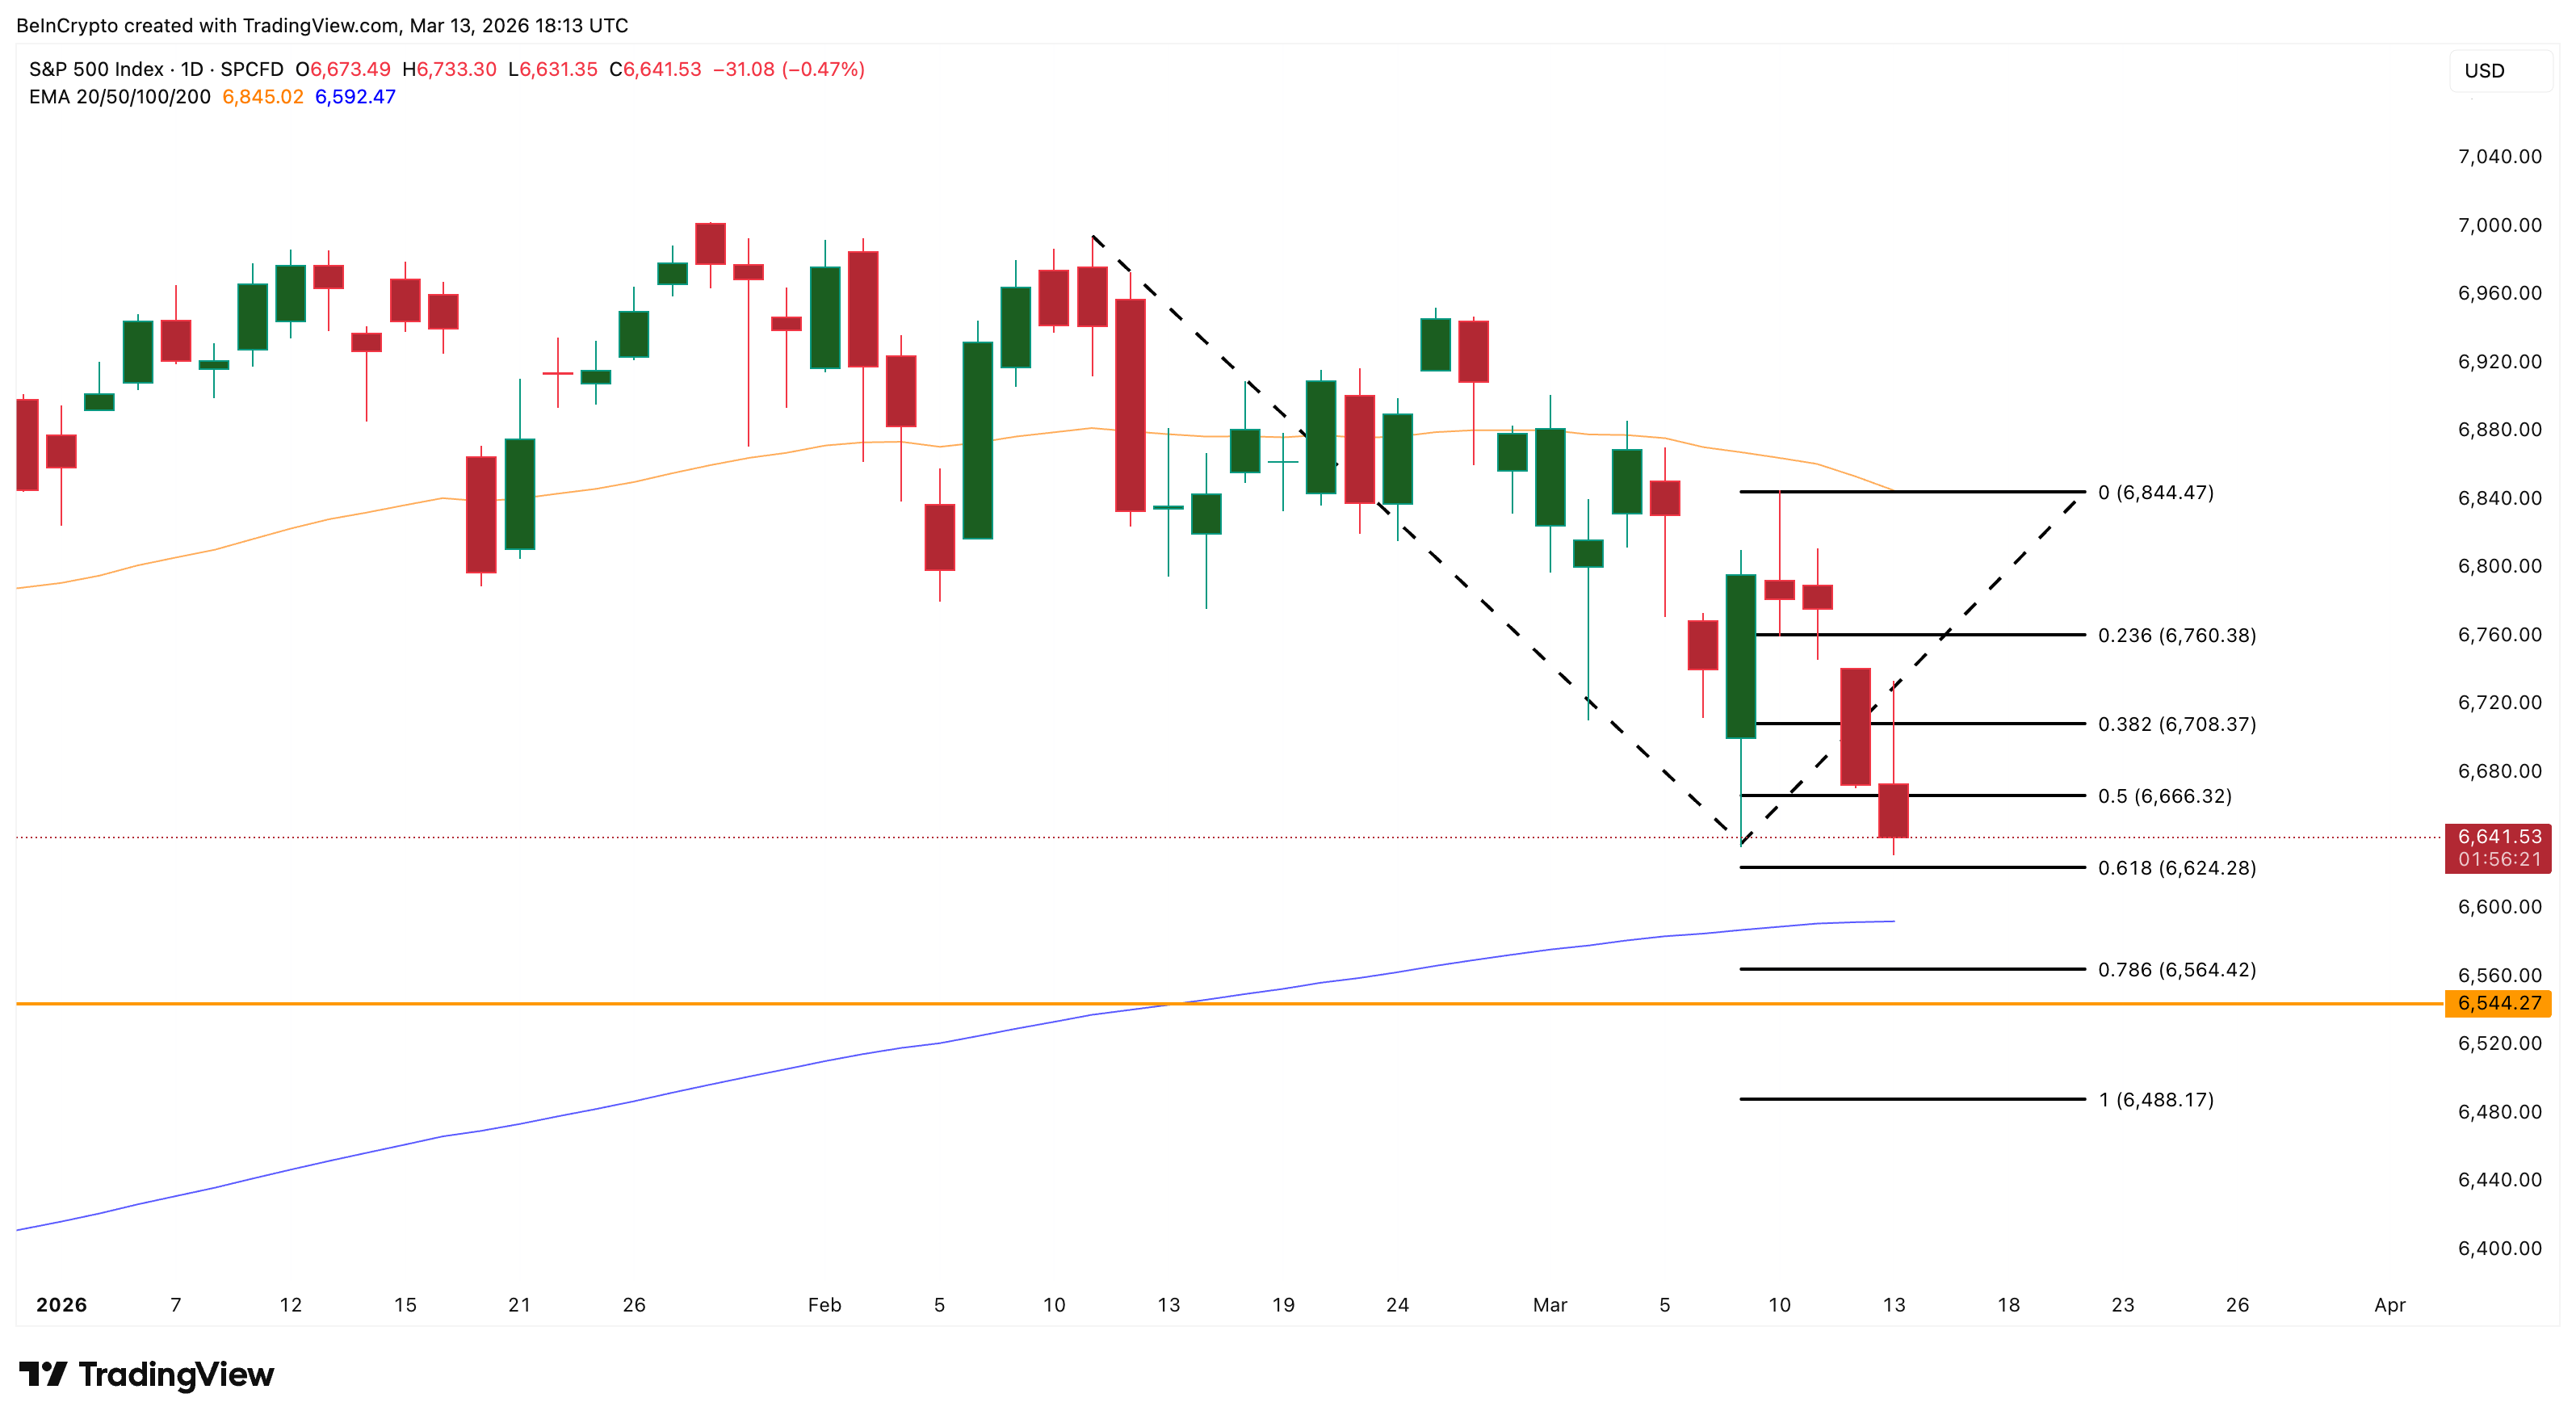 S&P 500 Analysis: TradingView
Recovery demands a reclaim of 6,700, while sustained strength above 6,840 would shift the near-term outlook back toward buyers.
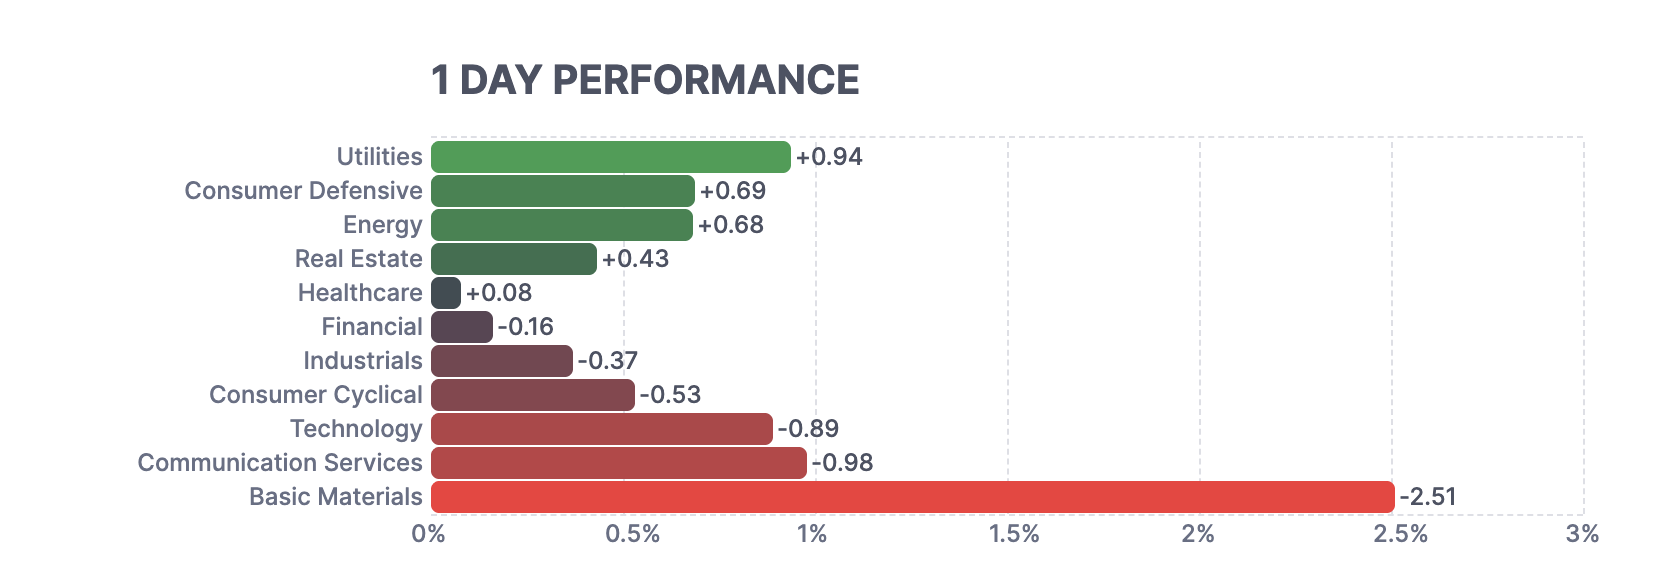
Which Stock Market Sectors Are Holding Up?
Investors moved money into defensive sectors.
These industries tend to perform better when economic uncertainty rises.
Top performers:
- Utilities (+0.94%)
- Consumer defensive (+0.69%)
- Energy (+0.68%)
- Real estate (+0.43%)
Utilities, in particular, benefited from strong electricity demand tied to AI data centers, which continues to support long-term growth for power infrastructure.
 US Stock Market Sectors: FinViz
Which Sectors Are Falling the Most?
Economically sensitive sectors saw the largest losses.
Worst performers:
- Basic Materials (−2.51%)
- Communication Services (−0.98%)
- Technology (−0.89%)
Basic materials companies rely heavily on industrial activity and manufacturing demand. With GDP growth slowing, investors expect weaker demand for metals, chemicals, and raw materials.
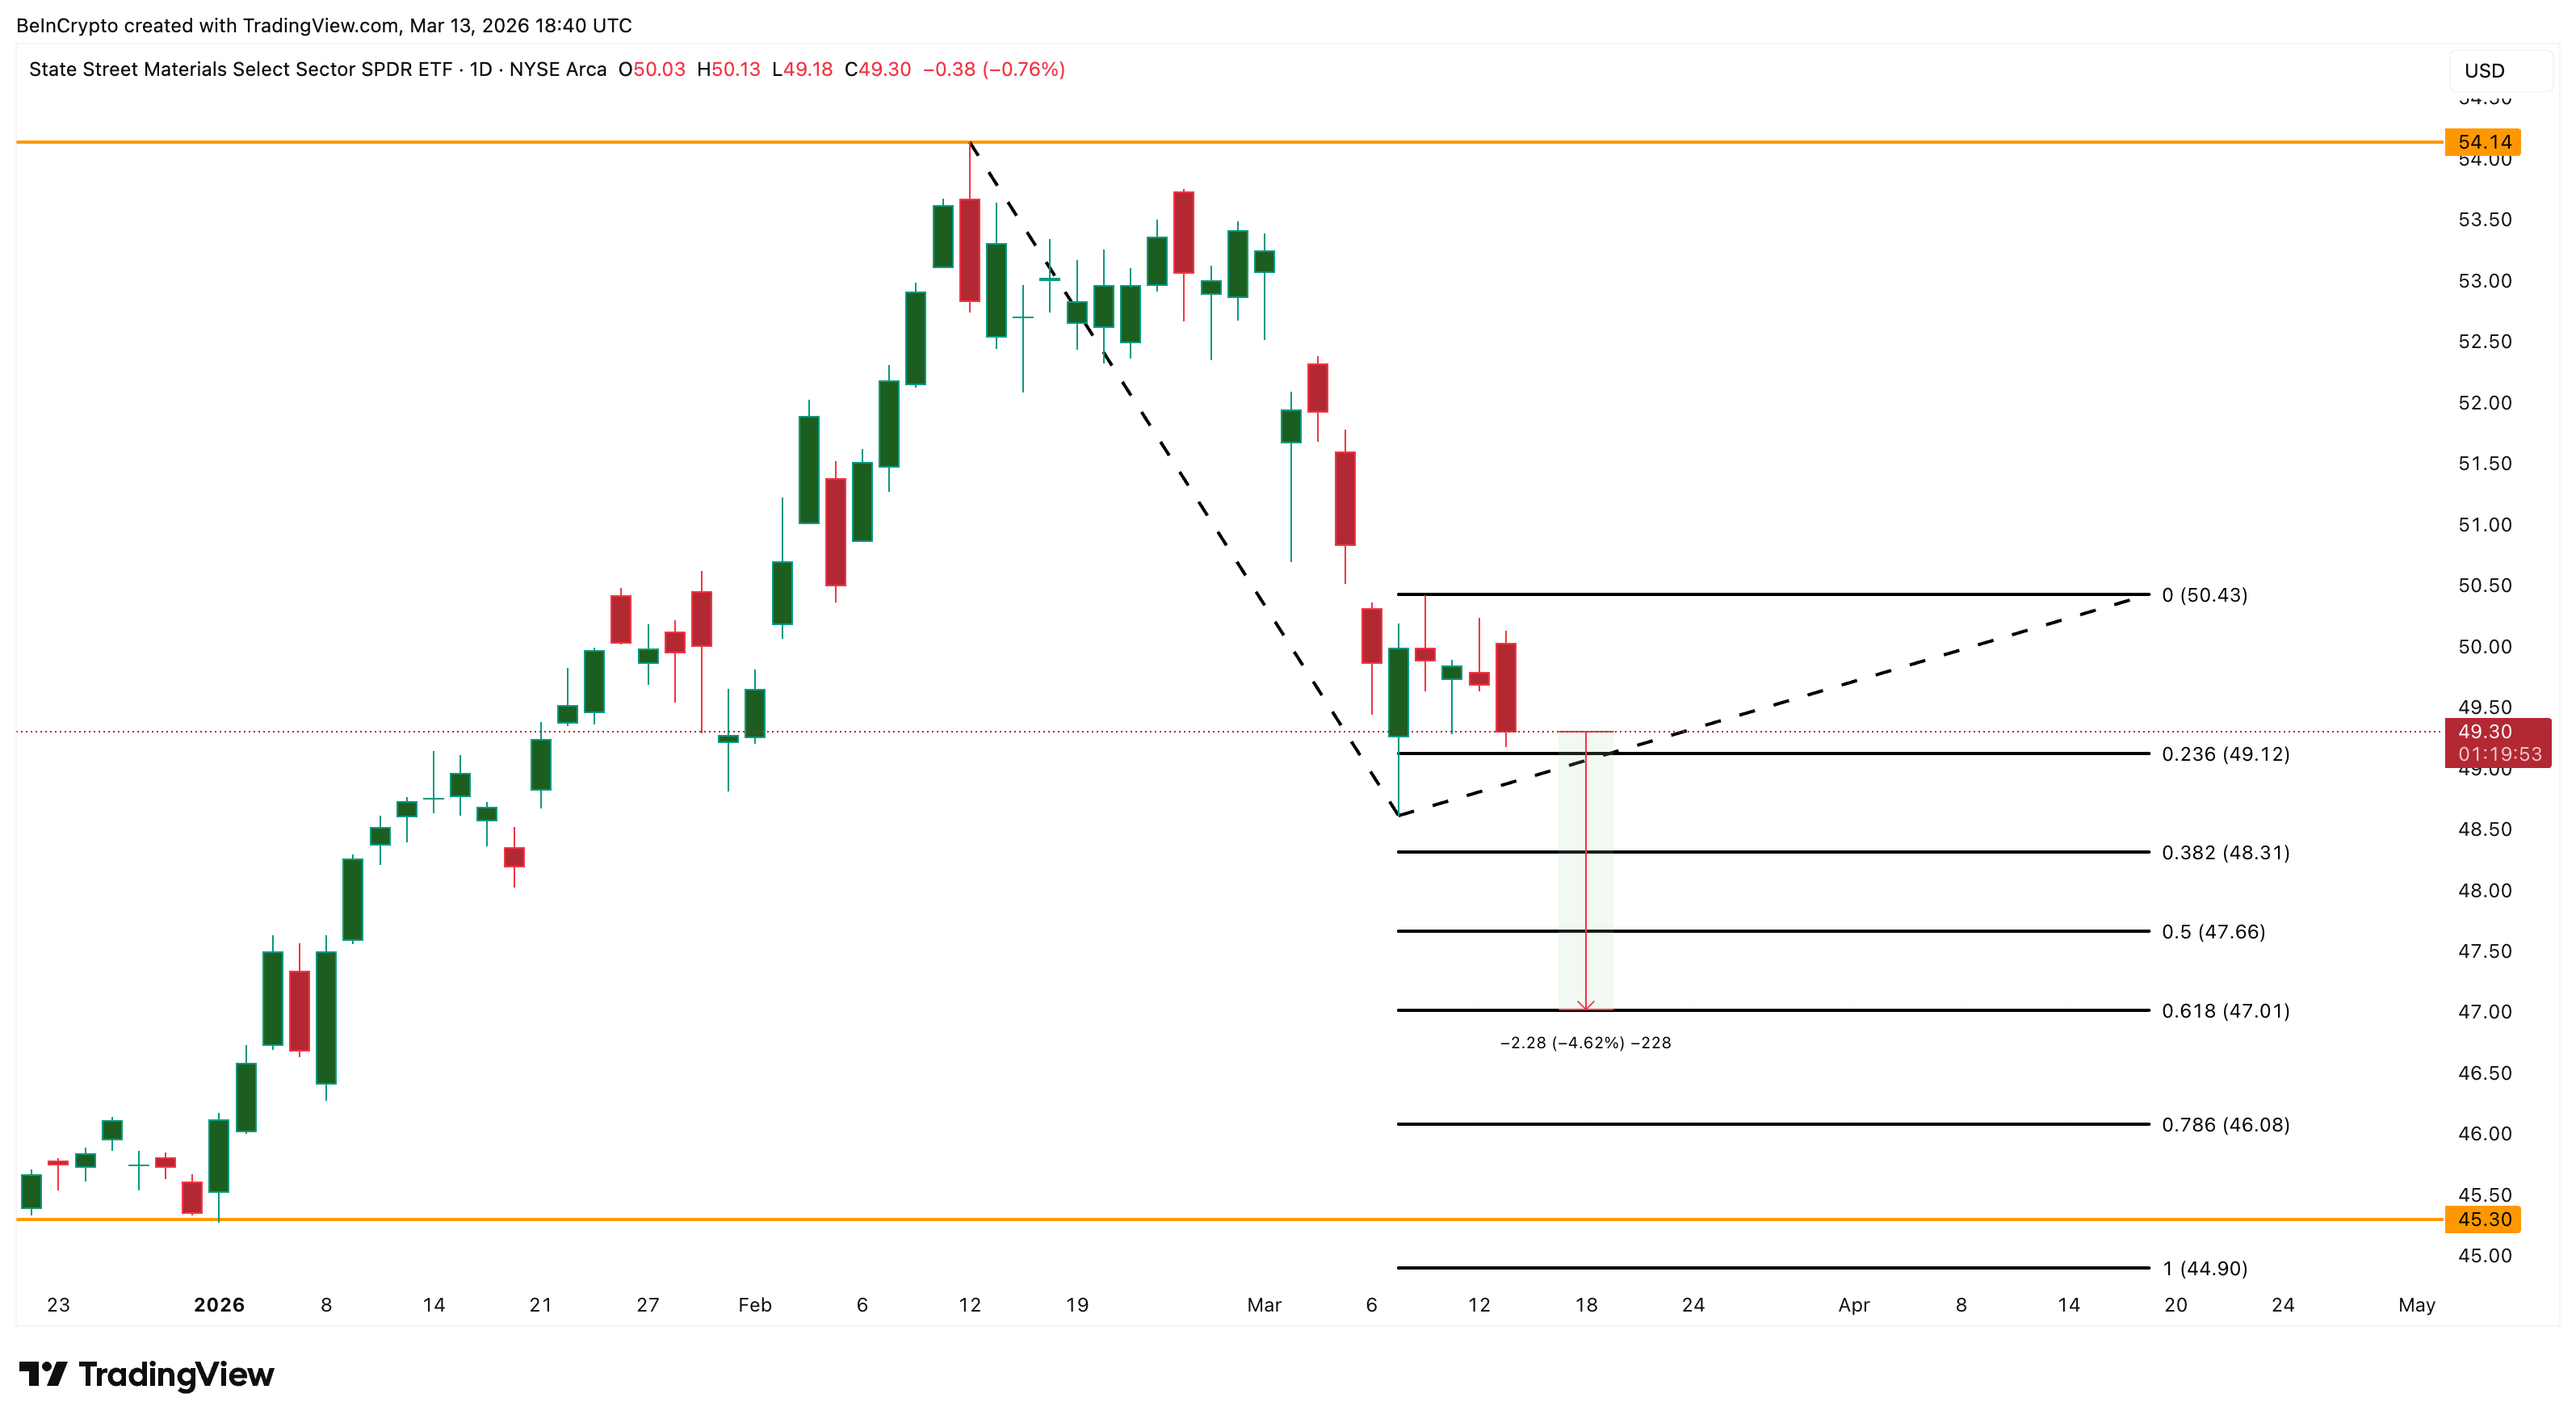 XLB Price Analysis: TradingView
Why Did Adobe Stock Drop?
Adobe stock fell more than 5%, trading near $255.
The decline followed news that the company agreed to a $150 million settlement with the US Department of Justice. The case focused on cancellation practices tied to Adobe’s Creative Cloud subscriptions.
The settlement itself is relatively small for Adobe, but it raises questions about the company’s subscription model. Investors are also watching leadership changes, with CEO Shantanu Narayen preparing to step down.
Adobe has been trending downward since January.
The stock dropped nearly 30% from $344 to about $243 earlier this year. Recent price action formed a bearish continuation pattern, suggesting sellers remain in control.
Key levels to watch:
- Support: $251
- Next downside levels: $229 and $195
- Recovery levels: $272 and $285
One positive signal remains. The Chaikin Money Flow indicator, which tracks institutional buying pressure, still sits above zero. This suggests some large investors continue accumulating shares despite the sell-off.
0
0


 Manage all your crypto, NFT and DeFi from one place
Securely connect the portfolio you’re using to start.

0
0

0
0

0
0
