Bitcoin Price Targets $90,000: Why the $78,000 Weekly Close is Critical

0
0
Bitcoin Stands at a Technical Crossroads
Bitcoin ($BTC) is currently testing a pivotal resistance level that could define the market's trajectory for the remainder of the second quarter of 2026. After a period of consolidation and geopolitical-driven volatility, the Bitcoin price has surged back toward the $77,000 - $78,000 range.
For traders and long-term investors, the focus is now entirely on the weekly candle close. Technical indicators suggest that flipping the $78,000 level from resistance to support would clear the path for a rapid ascent toward the psychological $90,000 barrier.
Is the BTC Breakout Real?
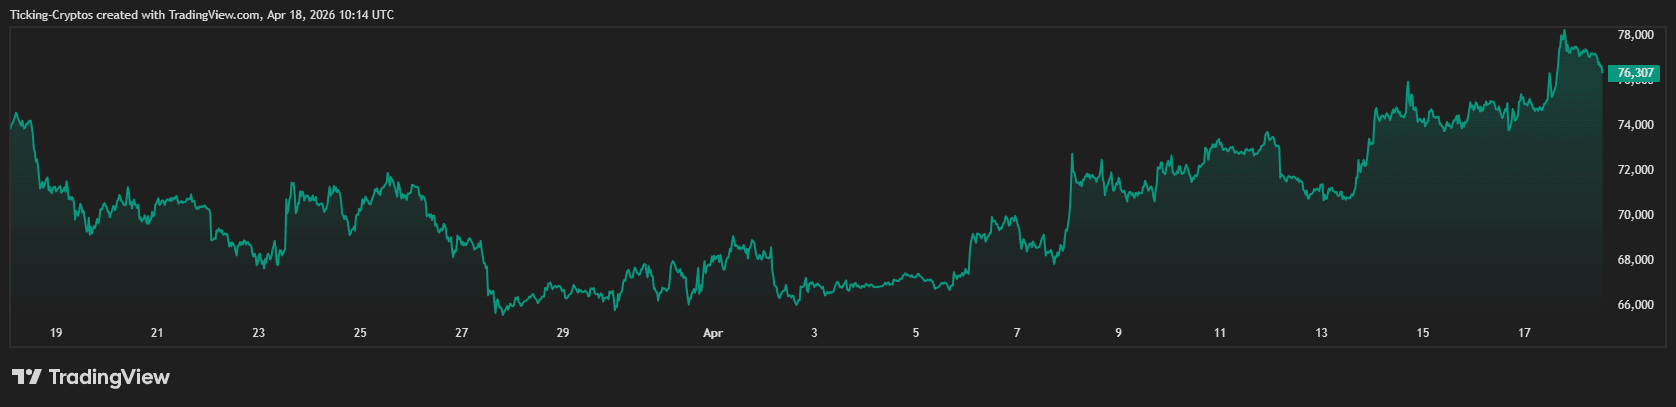
Yes, current market data confirms that Bitcoin is attempting a high-conviction breakout. As of April 18, 2026, $BTC is trading near $76,378, having touched intraday highs above $78,000 earlier this week. This move is supported by a significant shift in macro-economic sentiment, specifically the cooling of tensions in the Middle East and the temporary reopening of the Strait of Hormuz, which has lowered global inflation fears and bolstered "risk-on" assets.
Understanding the $78,000 Resistance Zone
In technical analysis, a "breakout" occurs when an asset's price moves above a defined resistance level with significant volume. For Bitcoin, $78,000 represents more than just a number; it is a structural ceiling established during the volatile swings of early 2026.
The Significance of the Weekly Close
Daily price spikes are often dismissed as "noise" or "fakeouts." However, a weekly close (Sunday at midnight UTC) provides a more reliable signal of institutional intent.
- Above $78,000: Confirms a trend reversal and sets a new floor for the next leg up.
- Below $78,000: Suggests the market is not yet ready to sustain higher valuations, likely leading to further consolidation near $70,000.
From Macro Drivers to Price Targets
The current momentum is fueled by a "perfect storm" of fundamental and technical factors:
- Macro Stability: The collapse of crude oil prices following ceasefire talks has redirected capital from commodities back into digital assets.
- ETF Inflows: Institutional demand via spot ETFs remains robust, with major players like Morgan Stanley’s MSBT absorbing sell-side pressure.
- Liquidation Cascades: According to data from Coinglass, a move above $78,500 would trigger the liquidation of billions in short positions, providing the "fuel" needed for a squeeze toward $85,000.
Price Targets: The Road to $90,000
If the weekly close remains bullish, analysts are eyeing two primary stages:
- Target 1 ($85,000): The first major Fibonacci extension level and a historical zone of interest.
- Target 2 ($90,000): A psychological milestone that would likely attract a fresh wave of retail FOMO.
Technical Analysis: RSI and Support Levels
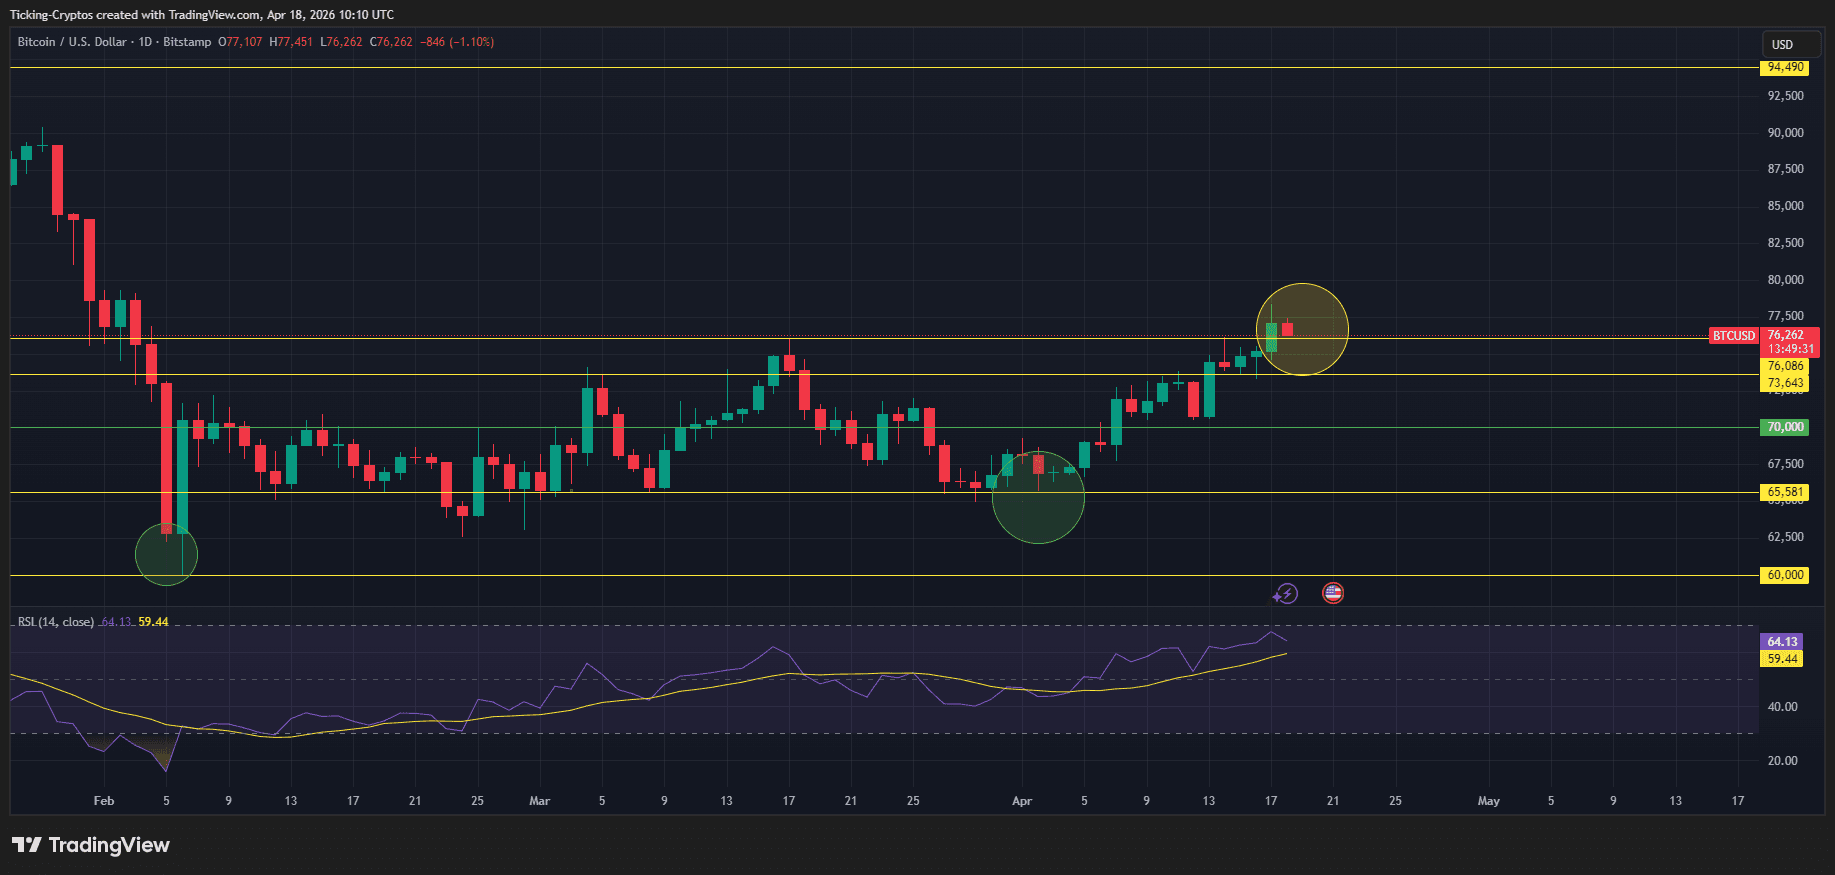
Examining the BTC/USD chart, the Relative Strength Index (RSI) is currently hovering around 64.13. While this indicates strong bullish momentum, it is not yet in the "overbought" territory (typically above 70), suggesting there is still ample room for upward movement before a cooling-off period is required.
| Support Level | Price (USD) | Significance |
|---|---|---|
| Immediate Support | $73,600 | Previous resistance turned support. |
| Psychological Floor | $70,000 | Critical psychological level for bulls. |
| Major Baseline | $65,500 | The "must-hold" level to keep the bull trend alive. |
0
0


 Manage all your crypto, NFT and DeFi from one place
Securely connect the portfolio you’re using to start.

0
0


