Solana (SOL) Prints Bullish Candle – Can Bulls Win The Next Round?

1
0


Solana (SOL) found support near $95 and recovered some losses. A bullish candle pattern is forming but the bulls face hurdles near $120.
Solana Price Recovery Faces Key Resistance
In the last technical analysis, we discussed the chances of more losses in Solana below the $120 support zone. The bears remained in action and pushed SOL price below the $112 support zone with a close below the 50-day simple moving average (blue). The price extended losses and even dived below the $100 pivot level.
Finally, the bulls took a stand near the $95 level. A low was formed at $95.26 and the price recently started an upside correction, like Bitcoin, Ethereum, and XRP.
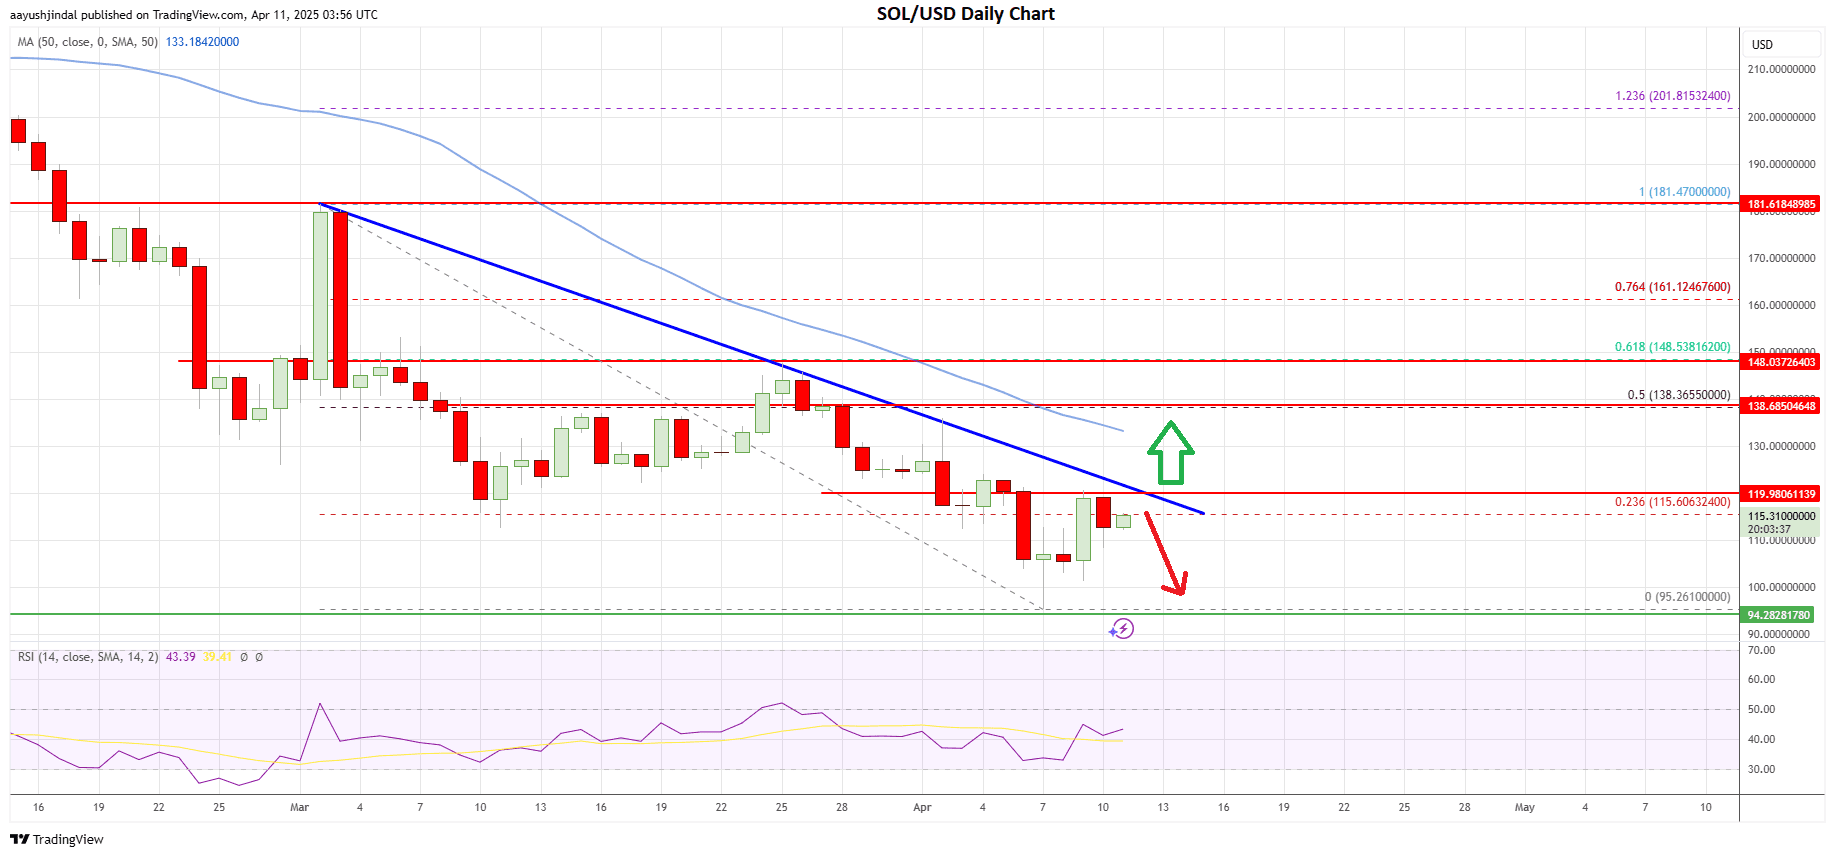
Solana is recovering from the $95 zone and there was a move above the $105 resistance zone. The price spiked above the 23.6% Fib retracement level of the downward move from the $182 swing high to the $95 low.
More importantly, it seems like there is a bullish candlestick pattern forming on the daily chart. If the bulls remain in action, they could attempt more gains.
Immediate resistance on the upside sits near the $118 level. The first major resistance sits near the $120 level. There is also a key bearish trend line forming with resistance at $120 on the daily chart. A close above the trend line resistance could decrease selling pressure and send the price higher toward the $130 resistance.
The next key resistance could be $132 and the 50-day simple moving average (blue). The main resistance could be $138 and the 50% Fib retracement level of the downward move from the $182 swing high to the $95 low.
A clear move above the $138 level could send the price toward the next key resistance at $148. A successful daily close above the $148 resistance might send the price toward the $165 level. Any more gains might send the price toward the $200 level or the 1.236 Fib extension level of the downward move from the $181 swing high to the $95 low at $202.
Another Decline In SOL?
If SOL fails to surpass the $120 resistance and the trend line, there could be another decline. Immediate support is near the $112 level. The first major support sits near the $105 level. If there is a close below the $105 support, the price might dive and test the $100 support.
The next key support could be the $95 level. Any more losses could send SOL toward the $84 support zone in the near term.
Overall, Solana price is showing a few positive signs above the $100 level. Having said that, SOL must settle above the $120 resistance zone and then clear $132 to start a fresh increase.
1
0

 Manage all your crypto, NFT and DeFi from one place
Securely connect the portfolio you’re using to start.


