Bonk (BONK) Plummets by Double Digits, Falls to Support Level

0
0

The value of the Solana-based meme coin Bonk (BONK) has witnessed a steep decline over the past week. Exchanging hands at $0.000021 at press time, BONK’s price has fallen by 24% in the past seven days.
This decline has caused BONK’s price to fall to the critical support level of the descending triangle pattern within which it has traded since May. Readings from some of its key technical indicators hint at the possibility of a further drop below this level.
BONK Bulls May Not Be Able to Defend Support
BONK’s one-day chart readings show that the altcoin has trended within a descending channel since May 29. At its current price, BONK’s value has since fallen by 42%.
This pattern appears when an asset’s price forms a series of lower highs and a horizontal support level. It confirms that the bearish trend will continue once the price breaks below the horizontal support level. At press time, BONK trades at this support level of $0.000021.
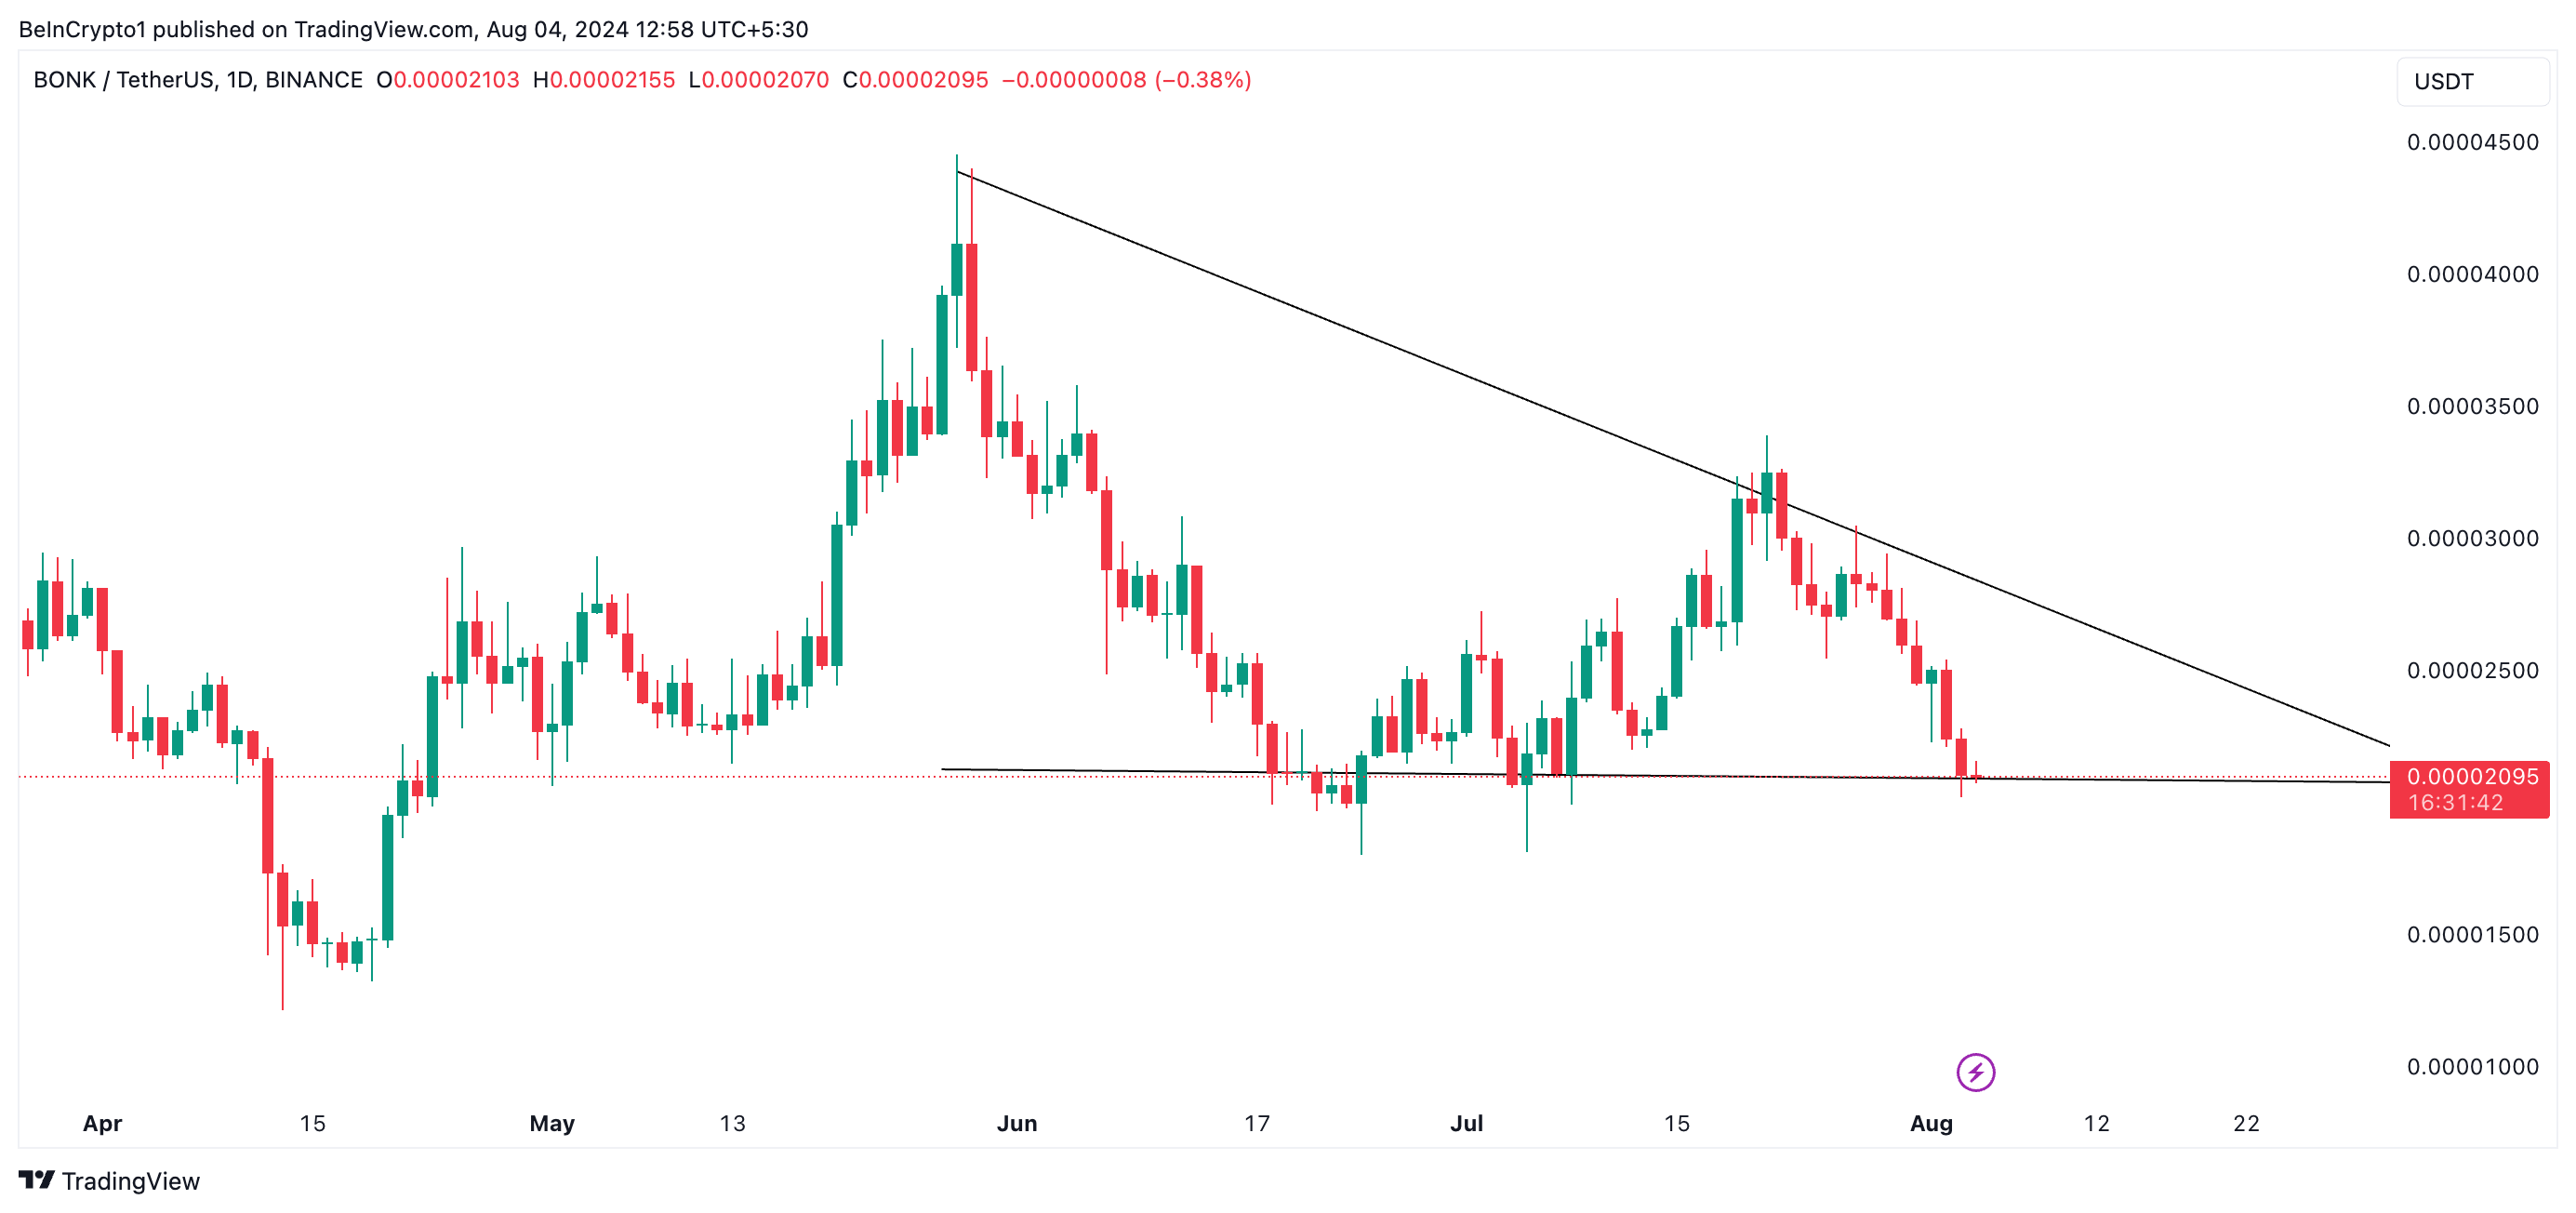 BONK Daily Analysis. Source: TradingView
Some of BONK’s key technical indicators assessed on a daily chart confirm the possibility of a break below this level and a continuation of the downtrend.
For example, BONK’s Relative Strength Index (RSI) is at 36.35 and in a downtrend as of this writing. This indicator measures an asset’s overbought and oversold market conditions.
Read More: How to Buy Solana Meme Coins: A Step-By-Step Guide
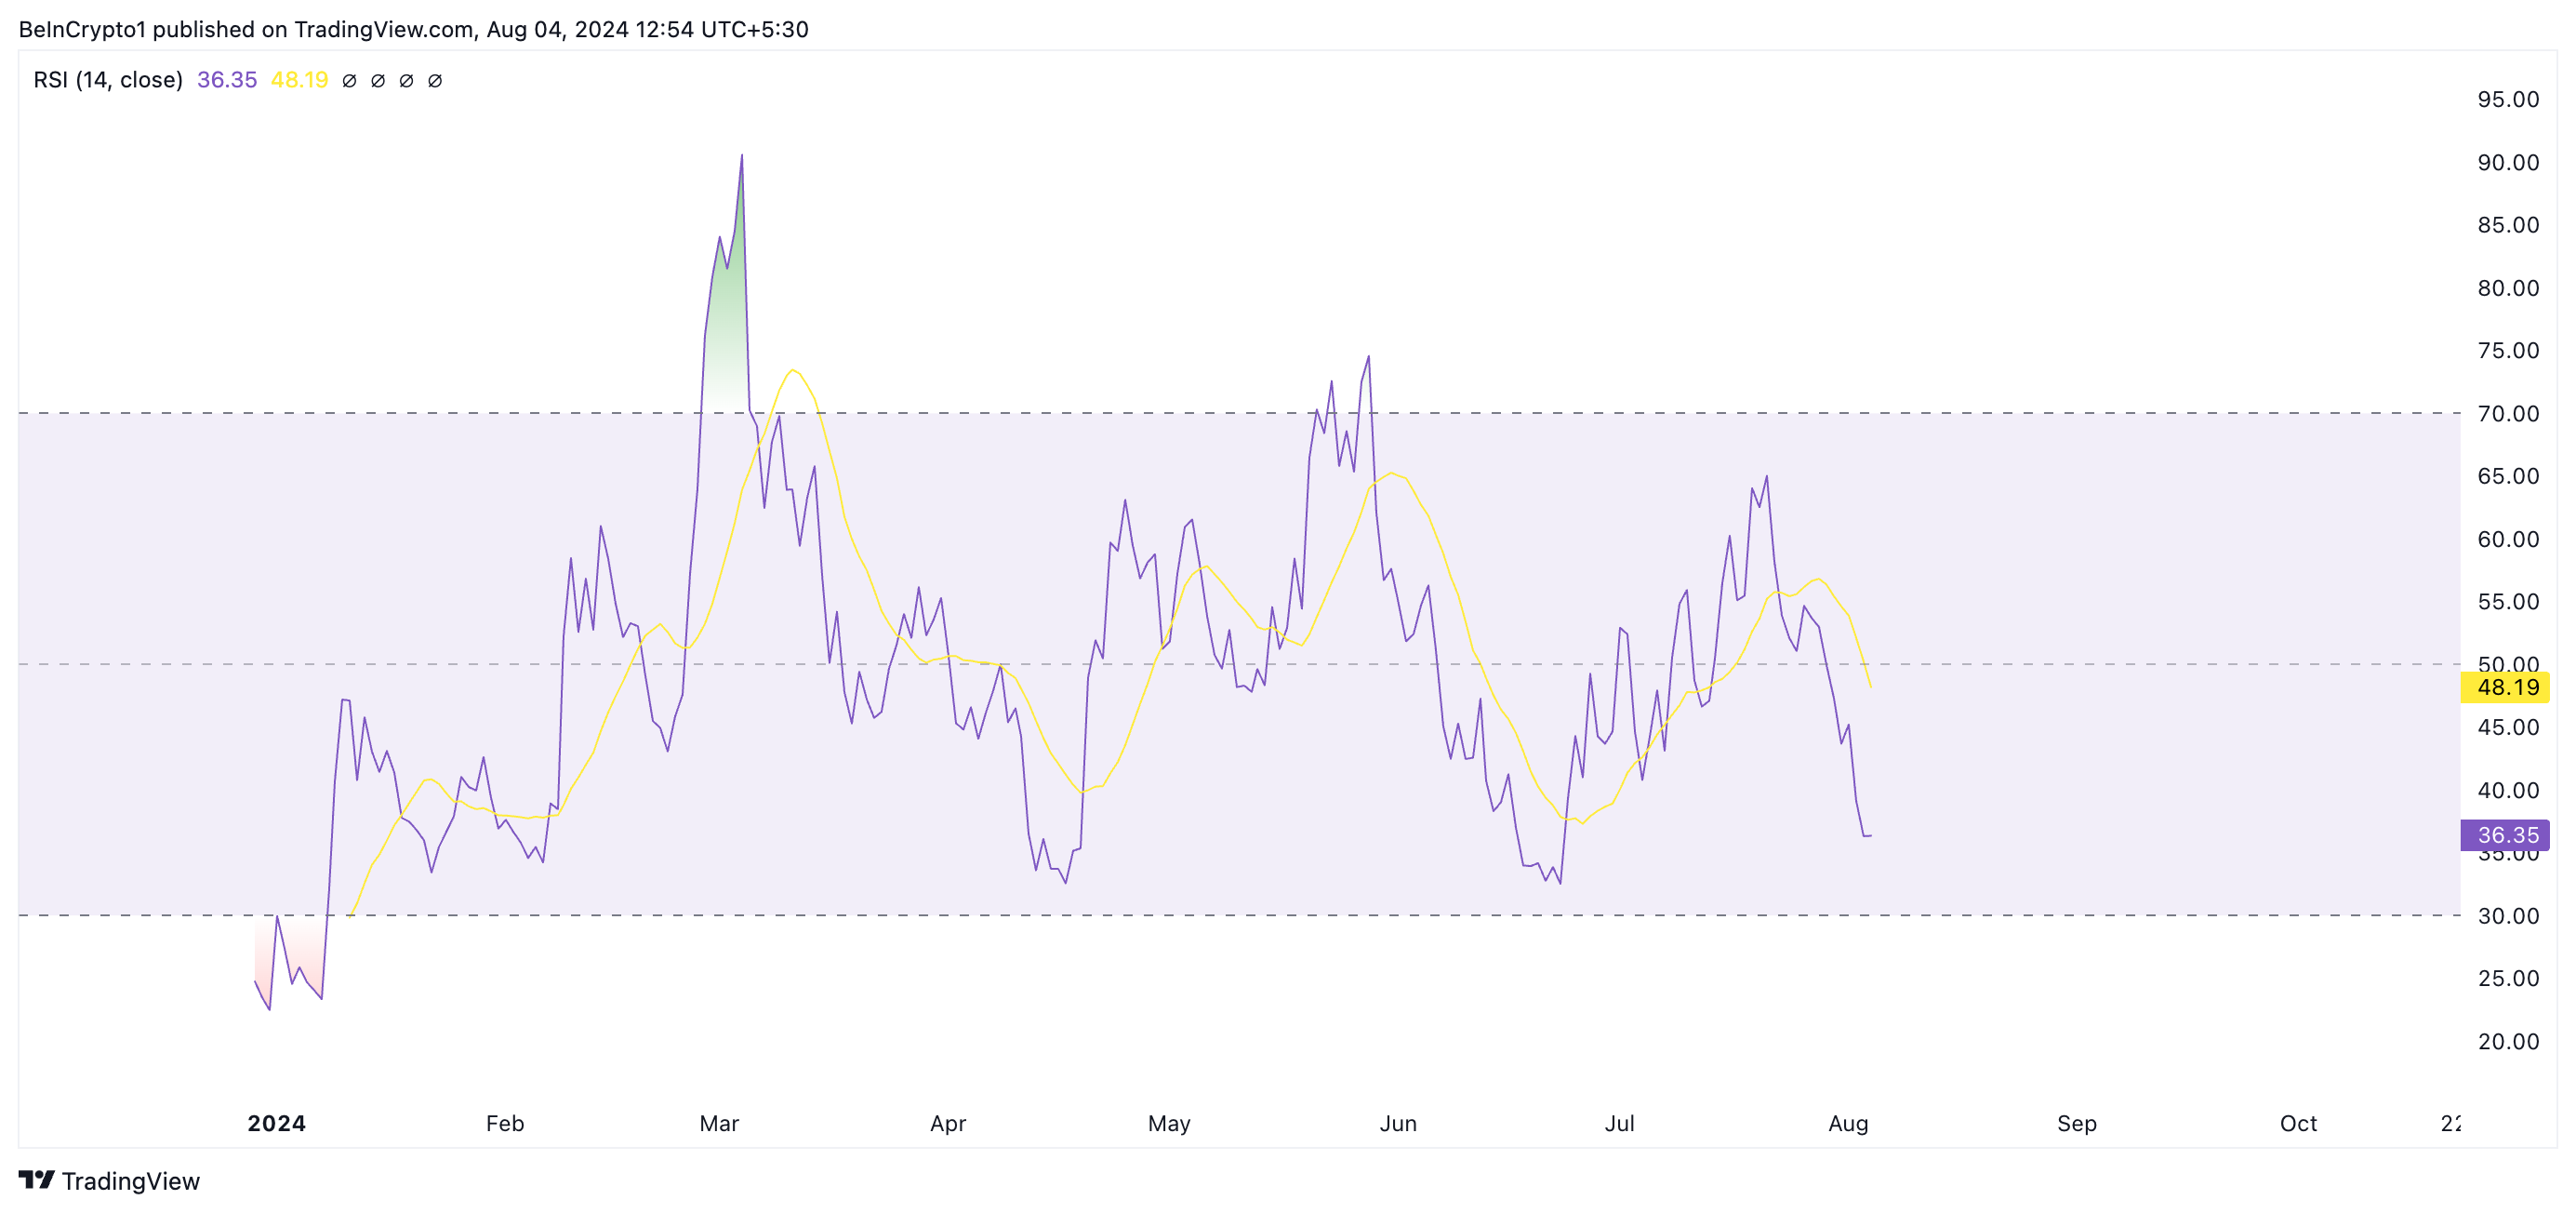 BONK Relative Strength Index. Source: TradingView
It ranges between 0 and 100, with values above 70 suggesting that the asset is overbought and due for a correction. In contrast, values below 30 indicate the asset is oversold and may soon witness a rebound.
BONK’s RSI value of 36.60 indicates significant selling pressure in the meme coin’s market. It shows that market participants have sold more of their holdings than they have bought new tokens, putting downward pressure on the altcoin’s price.
BONK Price Prediction: Is a New Low on the Horizon?
The setup of BONK’s Moving Average Convergence/Divergence (MACD) indicator confirms the bearish bias toward the meme coin. As of this writing, the MACD line (blue) rests below the signal (orange) and zero lines.
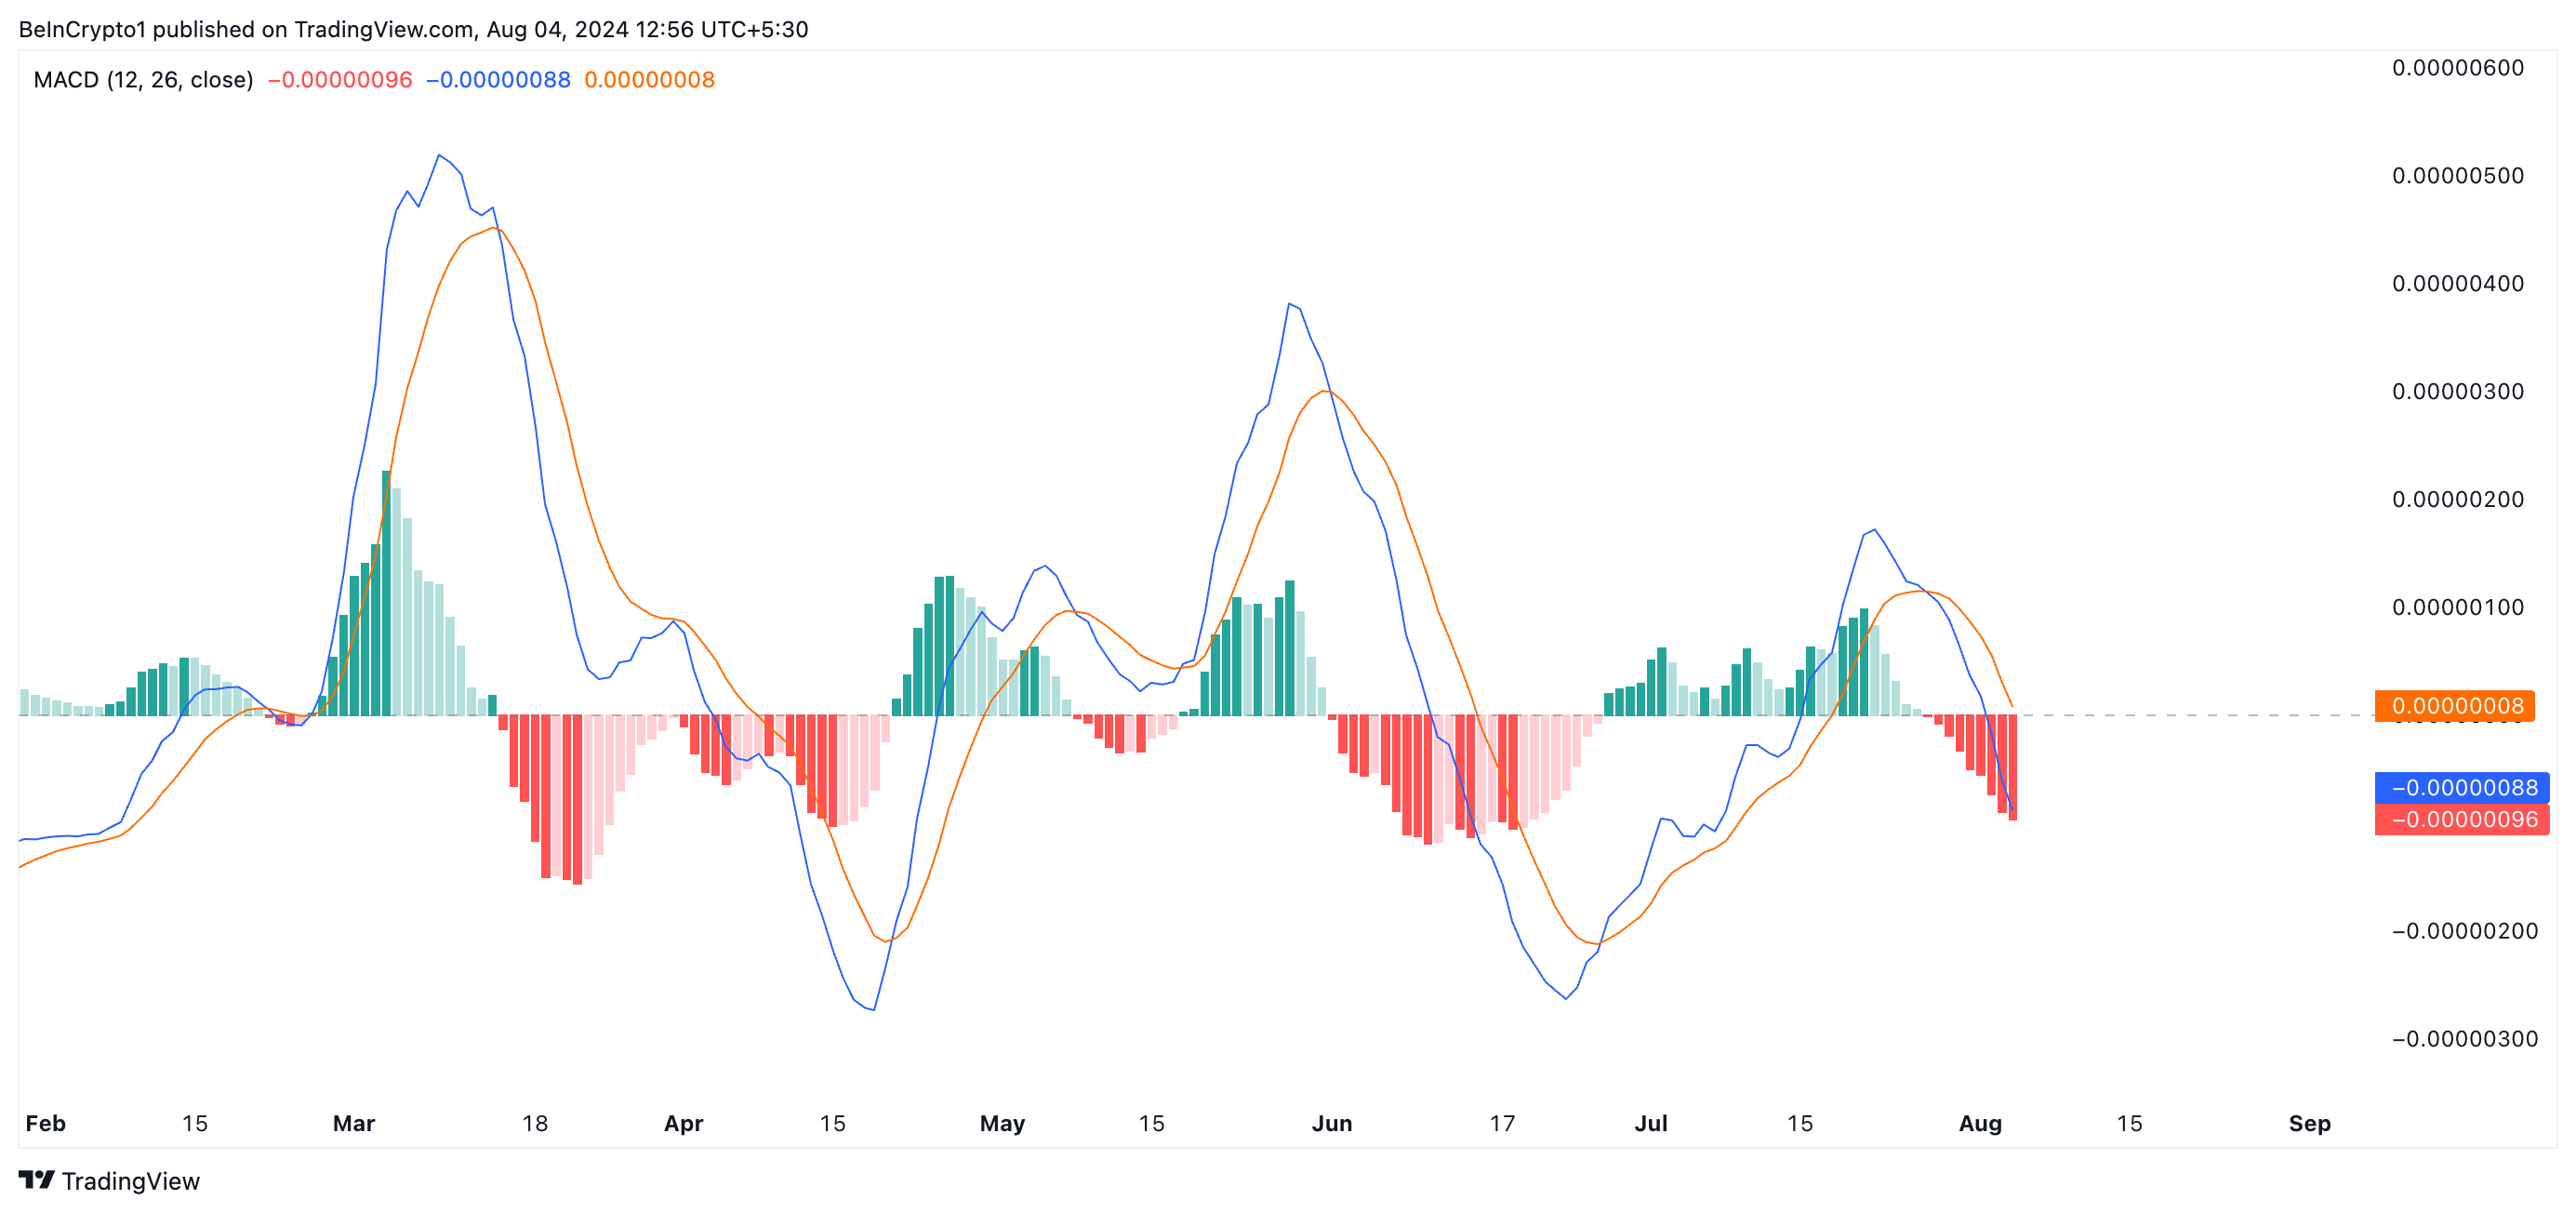 BONK Moving Average Convergence/Divergence. Source: TradingView
When an asset’s MACD line falls below the signal line, it suggests that its price momentum is decreasing and that a continued decline is imminent. A further cross below the zero line confirms that the downtrend is strong, as the shorter-term moving average falls further below the longer-term moving average. Traders interpret this bearish signal as a sign to exit long and take short positions.
If BONK bulls fail to defend the support level, the meme coin may fall to $0.000012. This represents a multi-month low that BONK last traded at on April 12.
Read more: Best Upcoming Airdrops in 2024
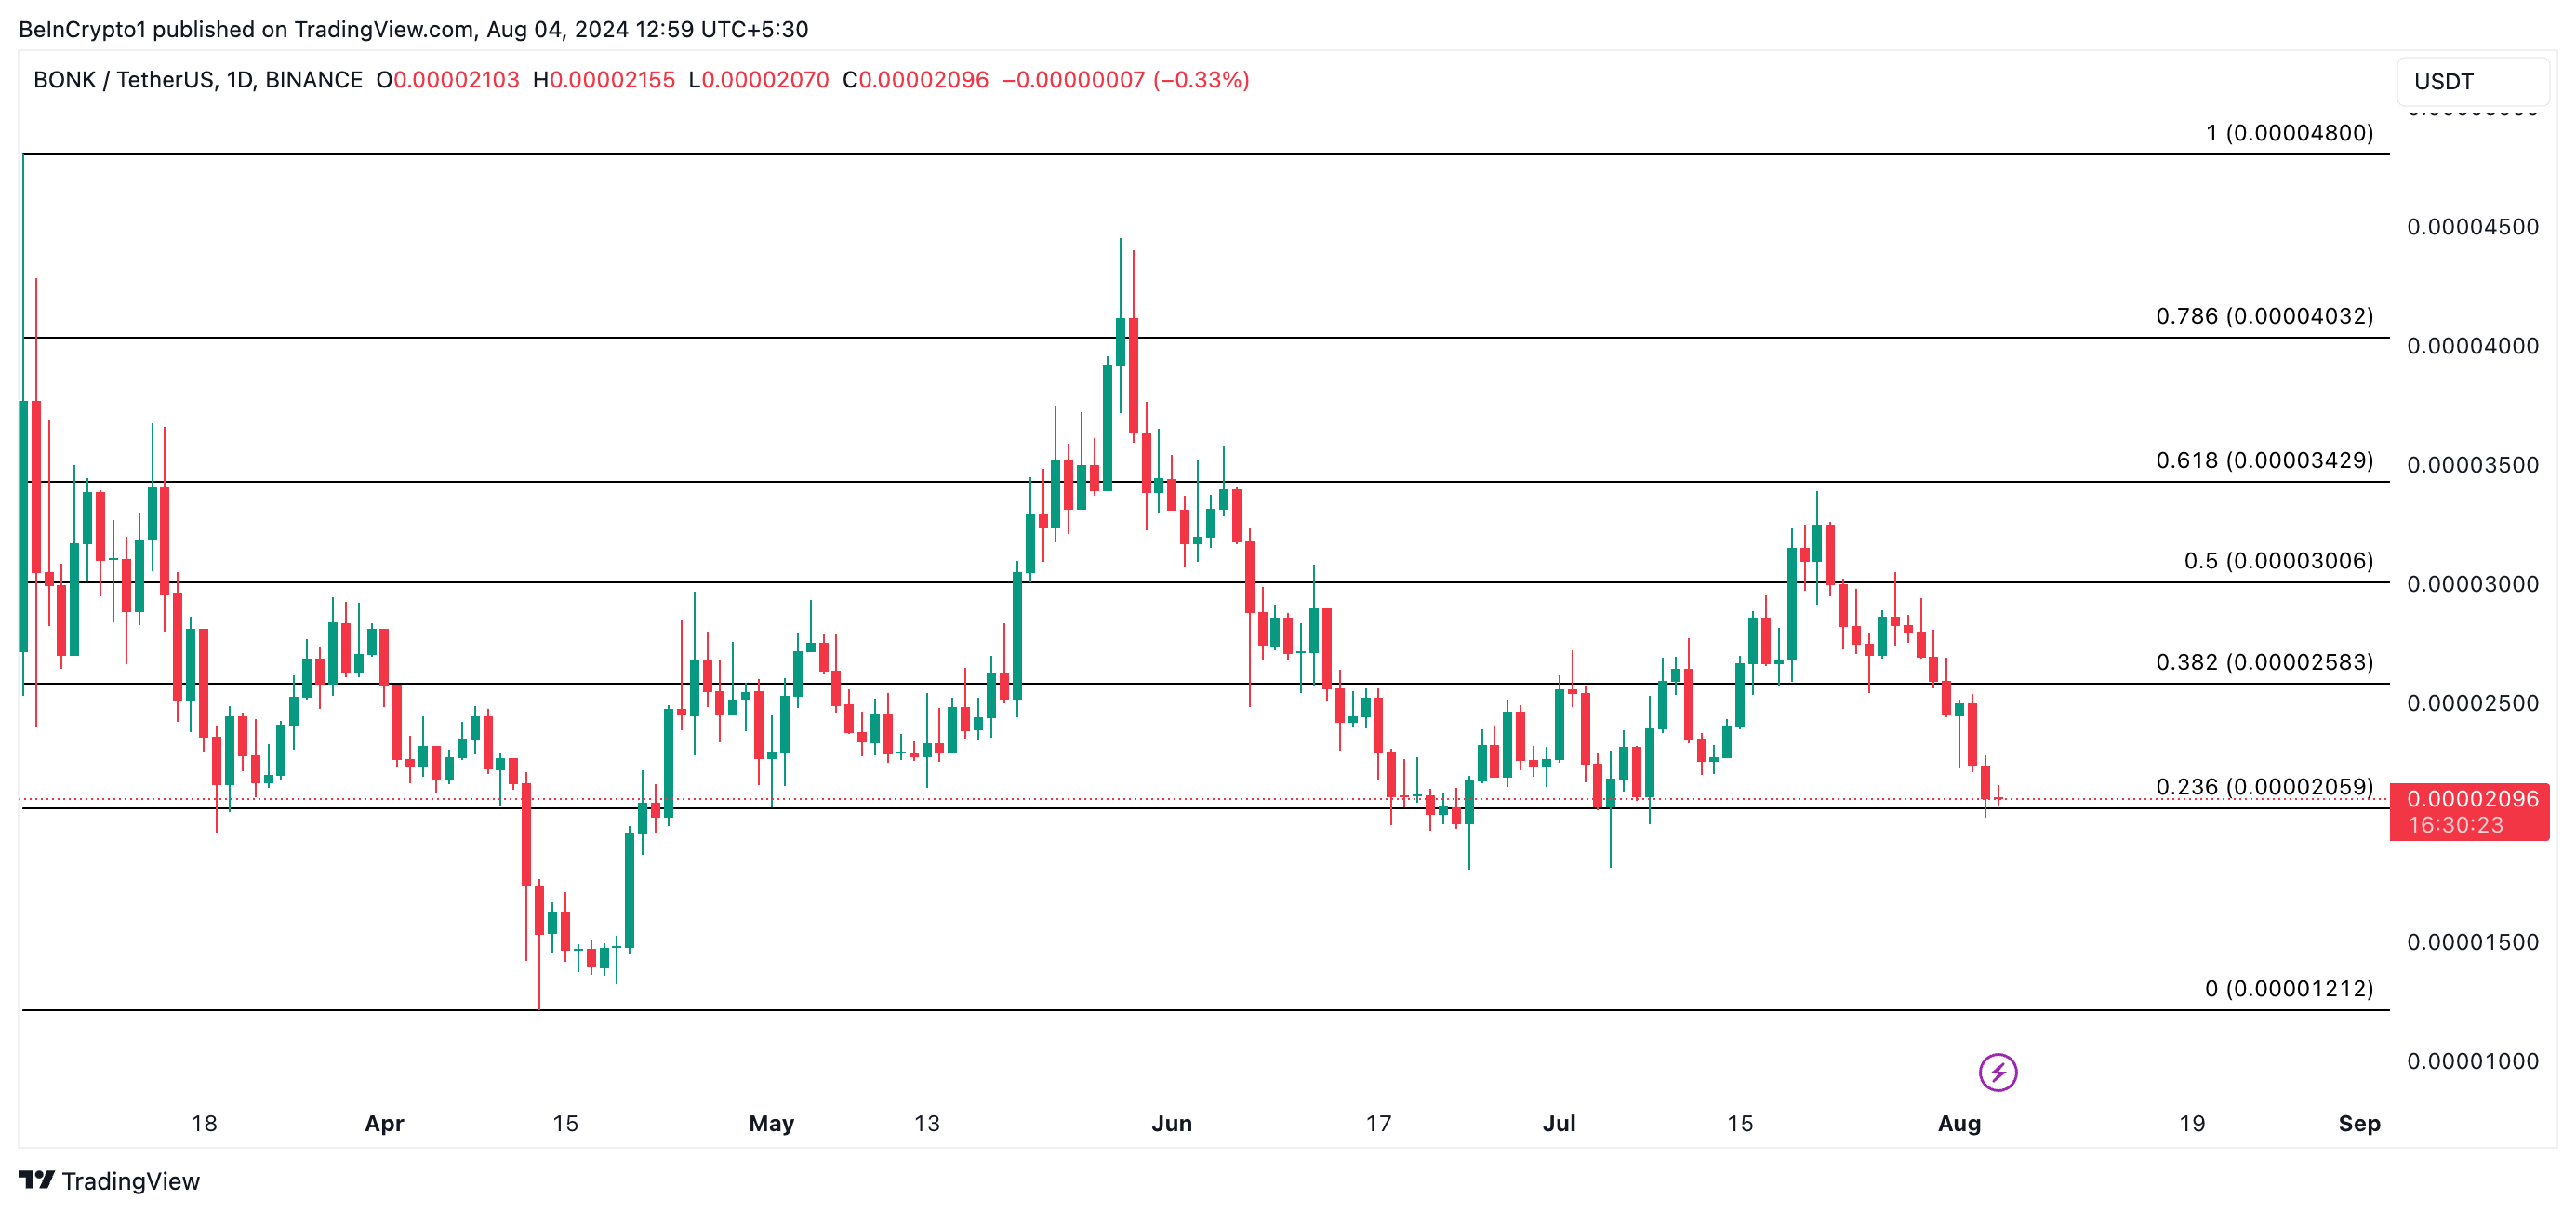 BONK Daily Analysis. Source: TradingView
However, if market sentiment shifts from negative to positive and BONK witnesses a spike in accumulation, this may drive its price up toward $0.000025.
0
0


 Manage all your crypto, NFT and DeFi from one place
Securely connect the portfolio you’re using to start.

0
0

0
0


0
0