
Bitcoin’s Next Big Test Emerges As $5B In IBIT Options Near Expiry

0
0


Bitcoin is trading above $78,000. September 18 is circled on every serious options trader’s calendar.
The gap between where price sits now and where max pain falls is one of the more unusual setups of 2026.
What Glassnode’s Data Actually Shows
Glassnode’s IBIT options breakdown shows roughly $5 billion in notional value expiring on September 18, 2026. Calls outweigh puts at nearly every expiry.
For the September 18 date specifically, $3.13 billion sits in calls against $2.02 billion in puts, according to Glassnode’s IBIT options analytics.
Max pain sits at $40 per IBIT share, which corresponds to approximately $71,000 in Bitcoin price terms.
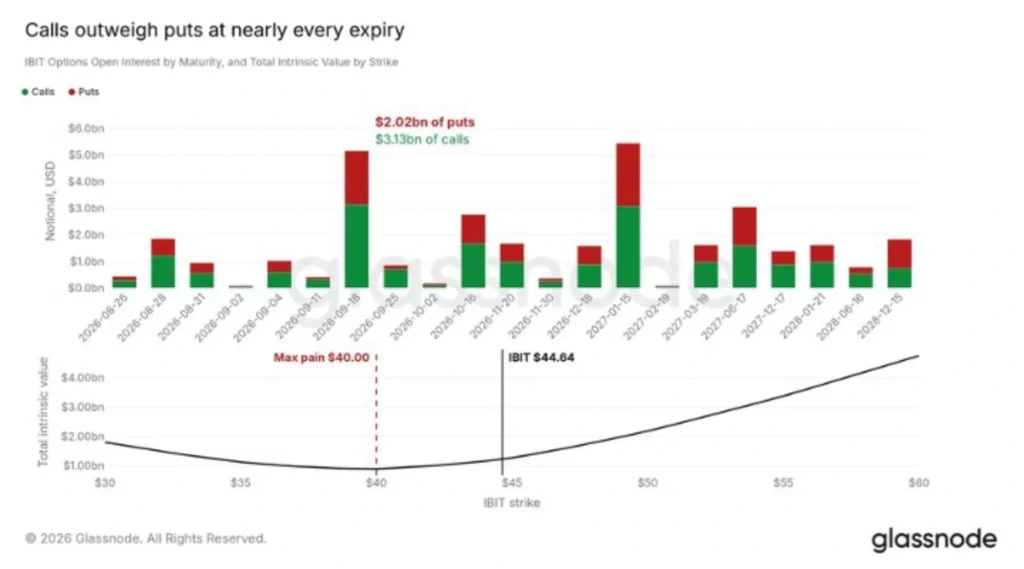
IBIT currently trades at $44.64, meaning Bitcoin would need to drop roughly 10% from current levels for max pain to be reached at expiry.
Why The Call-Heavy Skew Matters
When calls dominate open interest this heavily, dealers who sold those calls must buy more Bitcoin to stay delta-neutral as price rises.
That creates a reflexive dynamic: Bitcoin climbing toward $80,000 forces more buying, which pushes price further. It works in reverse too.
A fall toward $71,000 would see dealers unwinding hedges, adding selling pressure.
The SEC raised position limits on IBIT options to one million contracts in mid-2026, up from 250,000 previously, directly enabling the scale of open interest visible in this setup.
This Expiry Dwarfs What Came Before
To put September 18 in context, Techgaged reported in May that a $2.6 billion crypto options expiry on Deribit was considered a major market event at the time, with max pain sitting at $80,000 and a put-to-call ratio of 0.55.
A separate expiry later that month saw more than $7.6 billion in Bitcoin and Ethereum options expire on May 29, a date that coincided with BTC slipping below key gamma exposure zones near $73,300. September 18 is shaping up to be at least as consequential.
The Chart Heading Into September 18
As of 09:42 UTC on August 26, 2026, BTC/USD trades at $78,431.86 on the weekly chart, down 0.12% intraday.
Price has broken sharply higher since August 19, recovering from lows near $58,153 to reclaim the $78,000 zone.
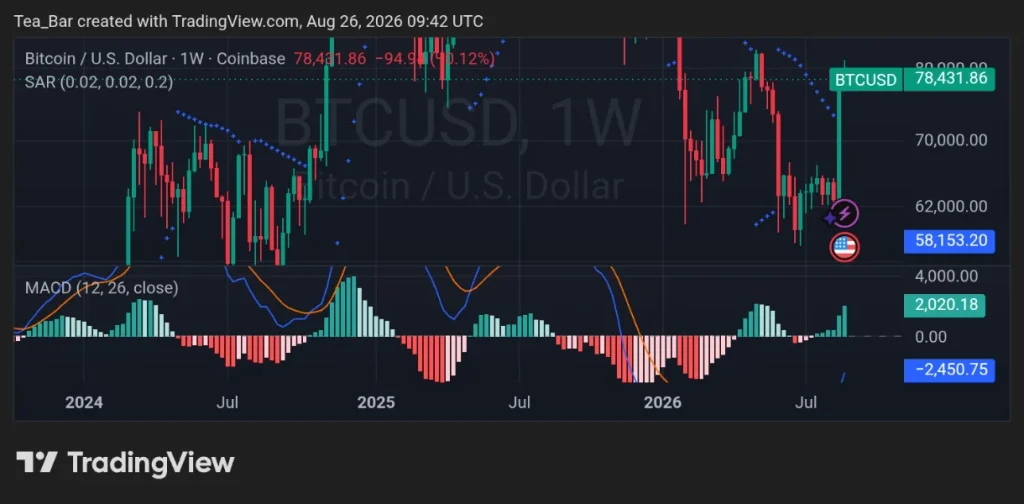
The weekly MACD histogram sits at 2,020.18, well into positive territory, though the signal line at -2,450.75 means the full bullish crossover hasn’t confirmed yet.
The Parabolic SAR dots have flipped below price on the weekly chart, a signal that has marked the start of sustained uptrends on this same chart twice before in 2024 and once in early 2025.
That flip, combined with the call-heavy options setup into September 18, puts the $80,000 level directly in focus as the next meaningful resistance.
Watch IBIT’s share price relative to the $40 max pain level over the three weeks leading to September 18.
A sustained hold above $45 would force continuous dealer hedging and could become self-reinforcing. A drop toward $41 to $42 changes the mechanics entirely.
Disclaimer:
This article is for informational purposes only and does not constitute financial, investment, or trading advice. The views expressed are based on publicly available data, market observations, and the author’s interpretation at the time of writing. Cryptocurrency markets are highly volatile and unpredictable, and past performance or current technical setups do not guarantee future results. Readers should conduct their own research and consult with a qualified financial advisor before making any investment decisions. TechGaged does not accept liability for any losses incurred based on the information presented.
The post Bitcoin’s Next Big Test Emerges As $5B In IBIT Options Near Expiry appeared first on TechGaged.com.
0
0

 Manage all your crypto, NFT and DeFi from one place
Securely connect the portfolio you’re using to start.


