Could XRP Price Repeat This 2017 Breakout Pattern and Rally Past $5 Soon?

0
0

Key Insights:
- XRP price has completed a 32-week consolidation, mirroring the same pattern seen before its 2017 breakout rally.
- Analysts suggest Week 33 could trigger an explosive move as XRP holds above $2.32 with rising momentum.
- A confirmed breakout from a multi-year symmetrical triangle has positioned XRP above key resistance zones.
XRP price has just finished a 32-week consolidation period. Consequently, it has drawn comparisons to other breakouts XRP in 2017. The speculation that the rally might extend above $5 has reappeared as technical indicators align.
XRP Price Mirrors 2017 Consolidation Structure
Notably, XRP price has been held in a tight 32-week single consolidation range that is strongly similar to the situation in 2017 before a breakout. The existing range was built in a few months, over a narrow volatility, and with the support of increasing demand zones and constant volume absorption.
According to historical analysis, XRP price underwent a comparable 32-week consolidation in 2017 and then initiated a big rally.
Recently, Ripplesinwales posted a chart pointing out this 32-week structure in 2017 and in its repeat in the present structure.

In both instances, the consolidations took place at the peak of a triangle. This structural similarity has prompted the analyst to track Week 33 as a potential breakout point.
Breakout From Multi-Year Triangle Confirmed
More so, another development supporting this view is XRP price breakout from a symmetrical triangle that has been forming since early 2021. This multi-year pattern compressed price action between descending and ascending trendlines.
According to RandomCryptoPal, XRP price recently closed above the triangle’s resistance line, a move that many interpret as a structural breakout confirmation.
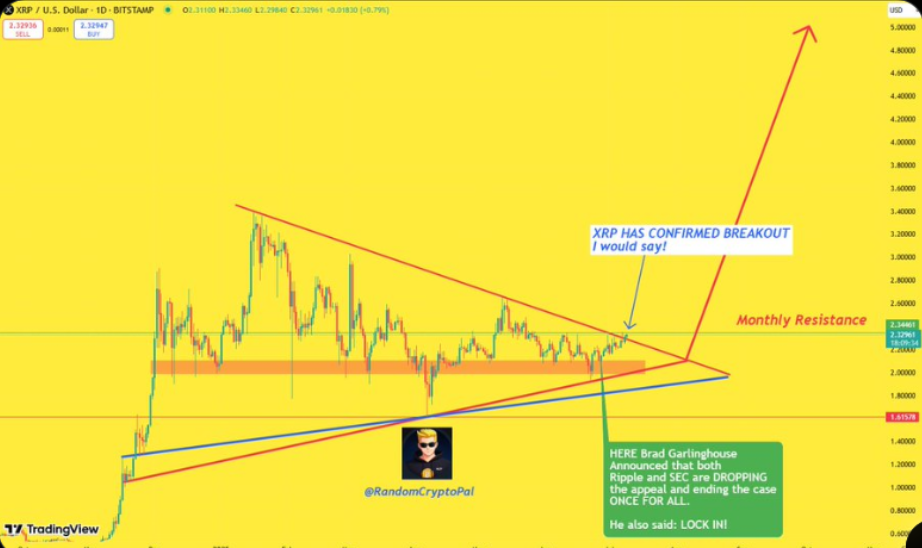
Additionally, this breakout has also occurred above a major monthly resistance zone, previously acting as a cap throughout the bear market phases. Breaking above both the horizontal resistance and the descending trendline simultaneously is often a bullish technical signal.
Besides, the chart shared showed a clear exit from the structure, with a follow-up consolidation near $2.32, indicating the potential for a retest and continuation pattern.
Key Price Levels and Technical Setups to Watch
As of the time of writing, XRP price was trading at around $2.30 and attempting to break key Fibonacci retracement values. In case the price remains above the breakout area, the next key resistance is between $2.90 and $3.50.
A breach of this zone could open the way for a retest of historical highs above $3.80, with $5 as the next major psychological target.
Another analyst, Dark Defender, observed that XRP price has become bullish in all timeframes, first time since January 2025. Such multi-time-frame convergence is usually a sign of underlying bullish momentum.
Subsequently, the analyst noted a confirmation of a broader market shift, especially when paired with structural breakouts and sustained price levels above key thresholds like $2.32.
Momentum Builds With Volume Support and Legal Clarity
Meanwhile, increasing trading volume that accompanies the breakout may be indicative of more widespread participation. Moreover, market sentiments concerning XRP have improved after speculations that Ripple and the SEC were in the process of settling their legal battle.
The specific result has not been confirmed, but the sentiment concerning legal resolution may have fueled the existing movement.
In addition, volume patterns between 2023 and 2025 also indicate a slow climb in the accumulation regions, just like the run to come in 2017. Should momentum be maintained and previous levels be met, the next target areas would be above $3.50. Additionally, the $5 mark is a long-term goal.
Further supporting a bullish outlook, recent analysis noted XRP price highest quarterly candle close in history above $2.25, signaling trend strength. Large wallet movements totaling over $500 million, alongside Ripple’s trust bank charter application, have fueled institutional speculation.
Analysts suggested that XRP reaching its previous BTC or ETH pair highs could open the path toward $20–$30 valuations.
The post Could XRP Price Repeat This 2017 Breakout Pattern and Rally Past $5 Soon? appeared first on The Coin Republic.
0
0

 Manage all your crypto, NFT and DeFi from one place
Securely connect the portfolio you’re using to start.

2
0


0
0

0
0