Alchemy Pay (ACH) Token Soars Nearly 40% as Market Signals Turn Bullish

1
0

- Alchemy Pay (ACH) price jumped 39% in 24 hours and 45% over the week, rebounding from below $0.020.
- ACH futures open interest spiked 153.64% to $33.53M, showing rising trader activity.
- Alchemy Pay teams up with Ethena to enable fiat purchases of USDe and ENA tokens.
Despite the overall underperformance of the crypto market, some cryptocurrencies have been seeing significant price surges. One such cryptocurrency is Alchemy Pay’s ACH token, which saw its price increase by more than 39.12% in the past 24 hours.
This surge follows a drop from its previous highs of $0.05805 recorded in early February. Since then, the ACH token has ranged between $0.020 and $0.035. However, Alchemy Pay price dropped below $0.020 last week, as the overall market suffered from a downturn triggered by Bitcoin’s (BTC) shake, following the tariff announcements by Donald Trump.
However, the token’s price recently rebounded, reaching an intraday high of $0.02909, up from a low of $0.02091. This marks an impressive 45% increase over the past week. As of now, ACH is priced at $0.02796, with a market cap of $249.4 million. Additionally, Alchemy Pay’s daily trading volumes spiked by over 448%, hitting $194.8 million.
The recent rally in the Alchemy Pay token follows the announcement of a strategic partnership with Ethena, an Ethereum-based synthetic dollar protocol. This collaboration introduces on-ramp support for USDe, a crypto-backed stablecoin, and ENA, Ethena’s governance token, enabling users to purchase these assets with fiat currencies via Visa, Mastercard, Google Pay, Apple Pay, and bank transfers.
To validate that, the open interest for Alchemy Pay has seen a remarkable increase, rising by 153.64% to reach $33.53 million. This surge indicates a sharp rise in market activity, suggesting that more traders are taking positions in ACH.
Bullish Indicators Support Alchemy Pay’s Uptrend
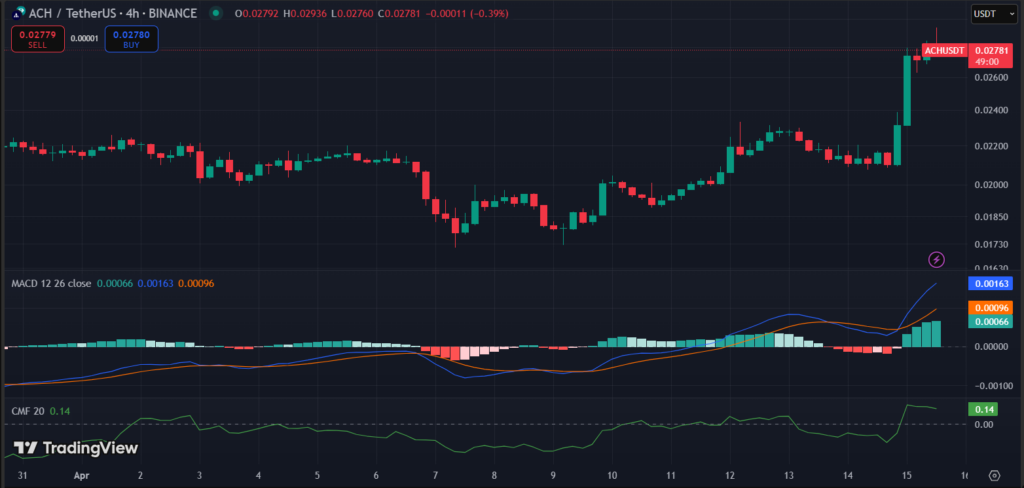
The 4-hour chart of ACH/USDT reveals a bullish breakout from a descending channel pattern that had been forming between approximately $0.0293 (upper boundary) and $0.0173 (lower boundary) over the past several days.
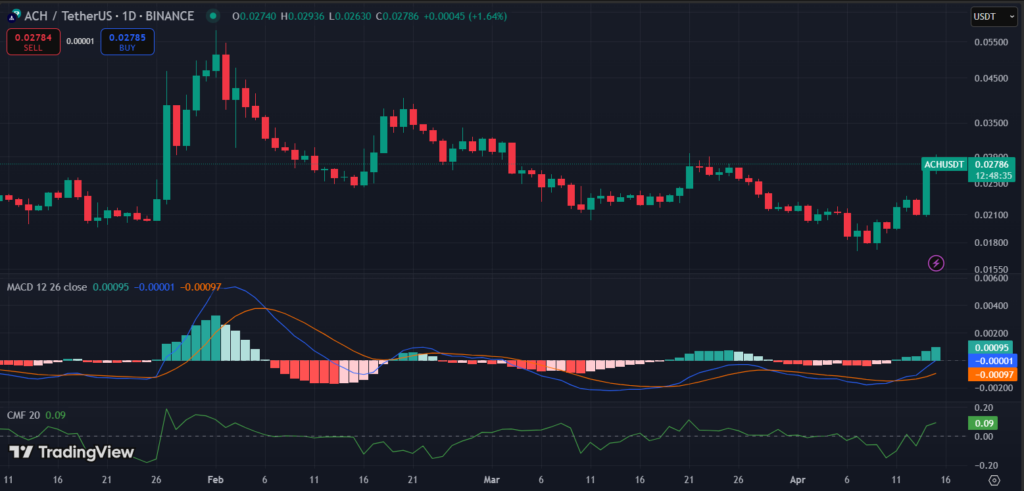
But in the daily chart of ACH/USDT, a falling channel pattern is clearly visible, with Alchemy Pay price respecting lower highs and lower lows within the range of approximately $0.0455 (resistance) and $0.0160 (support) over the past two months. This descending channel indicated sustained selling pressure. On April 15, Alchemy Pay broke out of this falling channel, closing at $0.02786, after touching an intraday high of $0.02936, marking a significant bullish reversal.
Zooming in, Alchemy Pay price also moved above the 50-day and 100-day EMA, confirming a bullish signal. Supporting this breakout, the MACD indicator shows a bullish crossover where the MACD line (0.00163) crossed above the signal line (0.00096). Additionally, the CMF value stands at +0.14, suggesting solid buying pressure and capital inflow into the asset.
The current price sits around $0.02781, and as long as it holds above the previous resistance turned support near $0.026, the breakout remains valid. This move opens up the possibility for ACH to retest the psychological resistance at $0.03 and beyond.
Highlighted Crypto News Today:
Binance and Other Crypto Platforms Experience AWS Data Center Outage Issue
1
0

 Manage all your crypto, NFT and DeFi from one place
Securely connect the portfolio you’re using to start.