
Bitcoin Price Prediction: Strong August Rally-What's Next for BTC?

0
0

Bitcoin price prediction traders are watching one thing right now, whether the world's largest cryptocurrency can turn a shaky trendline test into real momentum.
BTC has spent the past several sessions grinding along a rising support line, and the reaction at this level could decide where the next big move takes the market.
Liquidation books are already showing heavy activity on both sides, fresh headlines are calling out one of Bitcoin's strongest Augusts in years, and the charts are lining up a setup that traders will not want to miss. Here is the full breakdown.
Bitcoin Price Today and Live Market Data
$Bitcoin is trading at $77,771.9 at the time of this snapshot, down $335.86, or 0.43%, over the past 24 hours.
Futures volume over the last 24 hours stands at $52.15 billion, while spot volume is at $2.94 billion.
Market capitalization is holding at $1.56 trillion, and open interest across derivatives sits at $53.80 billion.
Circulating supply is 20.07 million BTC against a total supply of 20.07 million and a hard max supply of 21.00 million, keeping Bitcoin's scarcity narrative firmly intact heading into this Bitcoin price prediction cycle.
Source: CoinGlass, Bitcoin market data, August 31, 2026.
Bitcoin Latest News and Market Catalyst
Bitcoin's latest news backdrop is turning heads this week.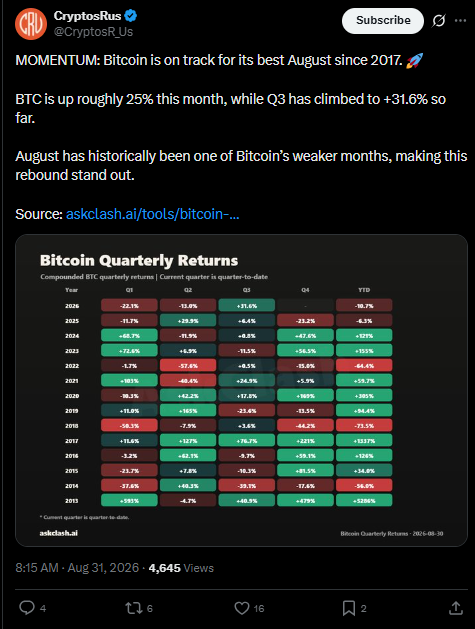
Market commentary account CryptosRUs flagged that BTC is tracking toward its best August since 2017, with the coin up roughly 25% for the month and the third quarter of 2026 already climbing past 31% quarter to date.
August has traditionally been a weak seasonal month for Bitcoin, which makes this rebound especially notable for anyone following Bitcoin price forecast trends into the final stretch of the quarter.
If the momentum holds into September, it could set the stage for a stronger seasonal run than markets have seen in years.
Source: CryptosRUs on X, August 31, 2026, 8:15 AM.
Bitcoin Liquidation Data Shows Long Side Under Pressure
Liquidation flow is leaning heavily against long positions right now.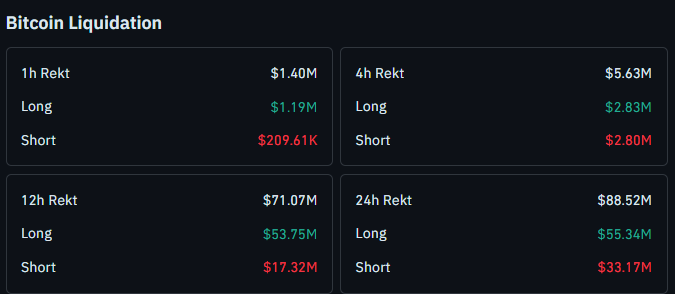
Over the past hour, $1.40 million in total positions were wiped out, with $1.19 million in longs liquidated against just $209.61K in shorts.
That imbalance widens further over four hours, with $5.63 million in longs liquidated versus $2.80 million in shorts.
Zooming out to 12 hours, $71.07 million in total liquidations hit the market, split between $53.75 million in longs and $17.32 million in shorts.
Over the past 24 hours, $88.52 million was liquidated overall, with longs losing $55.34 million against $33.17 million on the short side.
This pattern points to overleveraged long positioning getting flushed out as BTC cools off from recent highs.
Source: CoinGlass, Bitcoin liquidation data, August 31, 2026.
Quick Take
CMP: $77,687.2 (1-hour Binance BTC/USDT perpetual chart)
1-hour trigger level: close above $79,391.5 opens upside toward $81,526.5 and beyond
1-hour failure level: close below $75,611.2; shifts focus to $73,116.8
Data timestamp: August 31, 2026, 09:31 UTC+5:30
Risk note: weak buying at recent trendline touches means confirmation is needed before chasing the breakout
Bitcoin Technical Analysis Points to a Coiling Trendline Setup
On the 1-hour timeframe, $Bitcoin is currently taking support from an ascending trendline that has been in play since the last local low.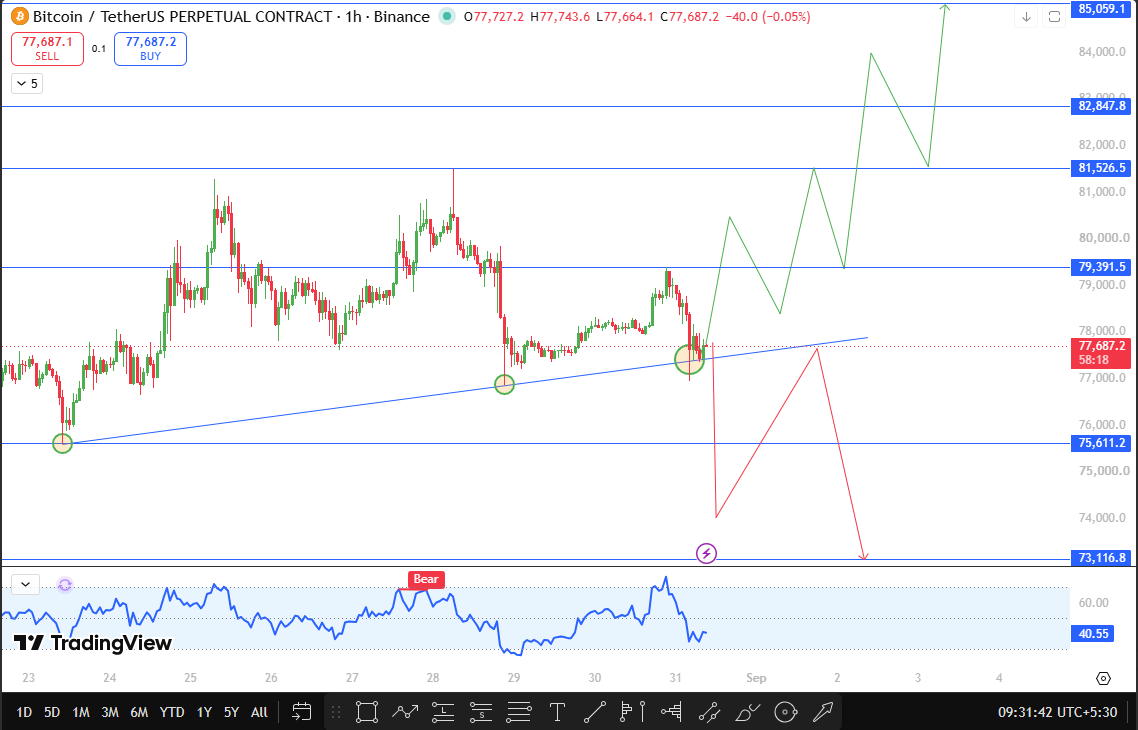
The trend has produced three touches so far, but the reaction at the second and third touches has lacked the aggressive, strong buying that would normally confirm a healthy uptrend.
That hesitation matters for anyone building a Bitcoin technical analysis view right now, because it suggests the trendline is being defended out of habit rather than conviction.
CMP is sitting at $77,687.2, just above the trendline itself.
If the price breaks and closes above $79,391.5 on the 1-hour chart, the next resistance to watch is $81,526.5, followed by $82,847.8, with $85,059.1 standing out as the major resistance zone for this Bitcoin breakout prediction.
On the downside, if BTC breaks and closes directly below $75,611.2, the next support level to track is $73,116.8.
The momentum reading(RSI) on the chart is currently tagged bearish near the 40.55 mark, which lines up with the soft buying seen on the recent trendline touches and adds weight to the idea that confirmation, not assumption, should guide the next move.
Source: TradingView, Bitcoin/TetherUS perpetual contract, 1-hour chart, Binance, August 31, 2026, 09:31 UTC+5:30.
For traders comparing setups across majors, this BTC price prediction lines up with a broader market that has been rewarding patience over the past month.
Bitcoin Support and Resistance Levels
Level Type | Price | Distance from CMP |
Major Resistance | $85,059.1 | +9.49% |
Resistance 3 | $82,847.8 | +6.64% |
Resistance 2 | $81,526.5 | +4.94% |
Resistance 1 (Trigger) | $79,391.5 | +2.19% |
CMP | $77,687.2 | — |
Support 1 (Failure) | $75,611.2 | -2.67% |
Support 2 | $73,116.8 | -5.88% |
Bitcoin Price Outlook: Bull, Base, and Bear Scenarios
In the bull case, $Bitcoin closes above $79,391.5 on the 1-hour chart and follows through with stronger volume than the last two trendline touches showed, pushing toward $81,526.5 and $82,847.8, with $85,059.1 as the stretch target.
In the base case, BTC keeps chopping along the ascending trendline without a decisive close on either side, holding roughly between $75,611.2 and $79,391.5. while the market waits for either stronger buying or a clean breakdown to force direction.
In the bear case, the price breaks and closes below $75,611.2, invalidating the trendline structure and opening a path toward $73,116.8, a scenario that would fit with the heavy long liquidations already showing up over the past 12 and 24 hours.
Risks to This Bitcoin Price Prediction
The biggest risk here is the weak buying reaction at the second and third trendline touches, which raises the odds of a false breakout if price pushes above $79,391.5 without real volume behind it.
Heavy long liquidations over the past 24 hours also show that leveraged positioning is fragile, meaning a sharp wick in either direction could trigger a fast cascade.
Broader macro headlines and any shift in the current risk-on mood tied to Bitcoin's strong August performance could also override the technical picture on short notice.
Glossary
Trendline: A line drawn along a series of price highs or lows used to identify the direction and strength of a trend.
Liquidation: The forced closing of a leveraged position when a trader cannot meet margin requirements.
Open Interest: The total number of outstanding derivative contracts that have not been settled.
Support and Resistance: Price levels where an asset has historically reversed direction due to buying or selling pressure.
Disclaimer
This article is for informational purposes only and should not be treated as financial advice. Cryptocurrency markets are highly volatile, and readers should conduct their own research before making any investment decisions.
0
0


 Manage all your crypto, NFT and DeFi from one place
Securely connect the portfolio you’re using to start.


