Celestia (TIA) Double Digit Price Rally Causes Trend Shift in Futures Market
5d ago•

bullish:
0
bearish:
0
Share

Celestia’s (TIA) price has initiated an uptrend following an extended period of decline. Trading at $7.30 at press time, the altcoin’s value has increased by 10% in the last week. In the past 24 hours, TIA’s price has surged by over 11%, ranking it third behind Helium (HNT) and Avalanche (AVAX) as one of the top assets with the most growth during this period.
The uptick in TIA’s price has led to a shift in market sentiments. With the token poised to extend its rally, its futures traders have begun to demand more long positions.
Celestia Futures Traders “Lock In’
The prolonged decline in TIA’s value caused many of its futures traders to bet against it. According to Coinglass’ data, the token’s funding rate across cryptocurrency exchanges was primarily negative between July 4 and 19.
Funding rates are used in perpetual futures contracts to ensure the contract price stays close to the spot price. When an asset’s futures funding rates witness a positive surge, it suggests a strong demand for long positions. It is considered a bullish signal and a precursor to an asset’s continued price growth.
Conversely, negative funding rates suggest a high demand for short positions. This is a bearish signal that shows market participants are betting against an asset’s price.
The uptick in TIA’s price in the past few days has led to a rise in the demand for long positions. This signals a shift in market sentiment from bearish to bullish. At press time, TIA’s funding rate is above zero at 0.0042%.
Read More: Best Upcoming Airdrops in 2024
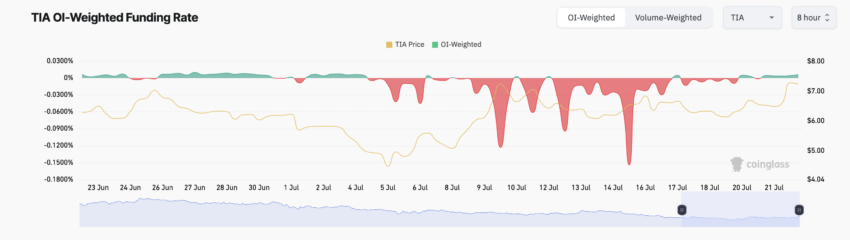 Celestia Funding Rate. Source: Coinglass
Confirming the bullish bias toward the altcoin, its futures open interest has also increased. At $176 million at press time, it has climbed by 40% since July 19.
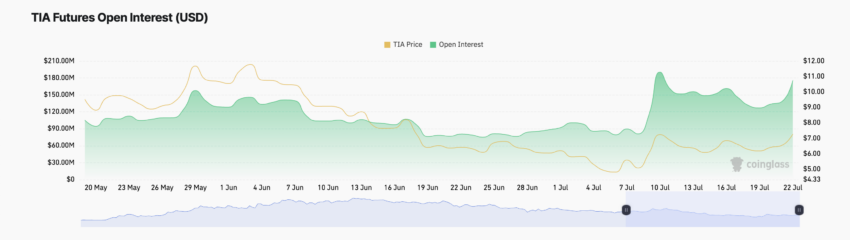 Celestia Futures Open Interest. Source: Coinglass
An asset’s futures open interest measures the total value of its futures contracts that have yet to be settled. When it rises, it suggests that more traders are entering the market and opening new positions.
TIA Price Prediction: Price Rally Might Be Here To Stay
An assessment of TIA’s price movements on a one-day chart confirms the possibility of an extended price rally.
Firstly, readings from its Parabolic Stop and Reverse (SAR) indicator show a strong bullish bias toward the altcoin. At press time, the indicator’s dots lie under TIA’s price.
This indicator tracks an asset’s trends and identifies its potential price reversal points. When its dots lie under price, the market is deemed to be in an uptrend. It indicates that the asset’s price has been climbing and may continue.
Also, TIA’s Chaikin Money Flow (CMF) is in an uptrend and currently rests above the zero line at 0.07.
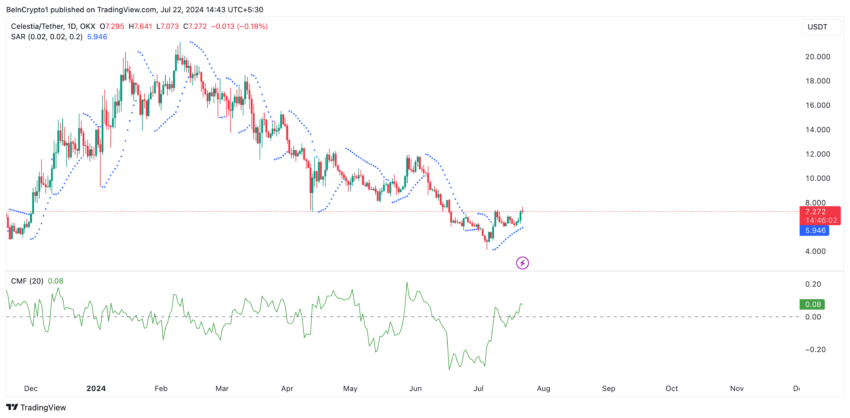 Celestia Price Analysis. Source: TradingView
This indicator measures money flow into and out of an asset’s market. When its value is positive, the market sees liquidity inflow, a precursor to a sustained price rally.
If this trend persists, TIA’s price may rally to $8.09.
Read More: Top 10 Aspiring Crypto Coins for 2024
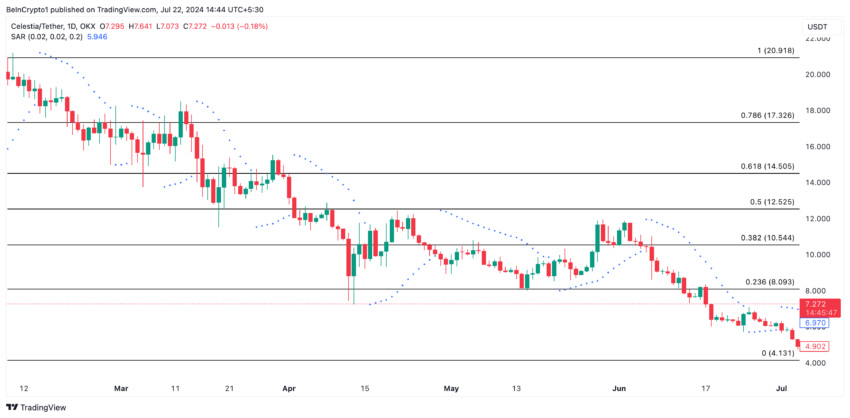 Celestia Price Analysis. Source: TradingView
However, a spike in selling pressure may cause the token to trade at an eight-month low of $4.13.
5d ago•
bullish:
0
bearish:
0
Share


 Manage all your crypto, NFT and DeFi from one place
Securely connect the portfolio you’re using to start.

bullish:
1
bearish:
0

bullish:
0
bearish:
1


bullish:
0
bearish:
0