
Bitcoin Price Prediction: Could BTC Bottom Out This October 2026?

0
0

Bitcoin is holding near $63,000 this week. The world's largest Bitcoin trades near $63,000 as traders eye an October bottom. See the key levels, ETF flows, and what could move BTC next.
Cryptocurrency has spent August moving in a tight band, unable to break higher and unable to fall apart either.
That range is now the center of a bigger debate. Some traders think this quiet patch is the last stretch before a cycle bottom. Others see it as just another pause in a slow bleed.
Here is what the charts and the flows are actually showing right now.
Where is Bitcoin's price today?
BTC changed hands around $63,000 to $63,100 over the weekend, down from highs near $65,300 earlier this month. The coin lost about 2.7% last week as weekend trading thinned out and buyers stayed on the sidelines.
Bitcoin remains well off its all-time high of $126,080, set back in October 2025. At current levels, it trades roughly 50% below that peak.
Metric | Value |
Current price | ~$63,000 |
Weekly change | -2.7% |
Immediate resistance | 65,000-66,000 |
Key support | 60,000-62,300 |
Deeper support | 57,000-55,000 |
All-time high | $126,080 (Oct 2025) |
What does the Bitcoin chart pattern show?
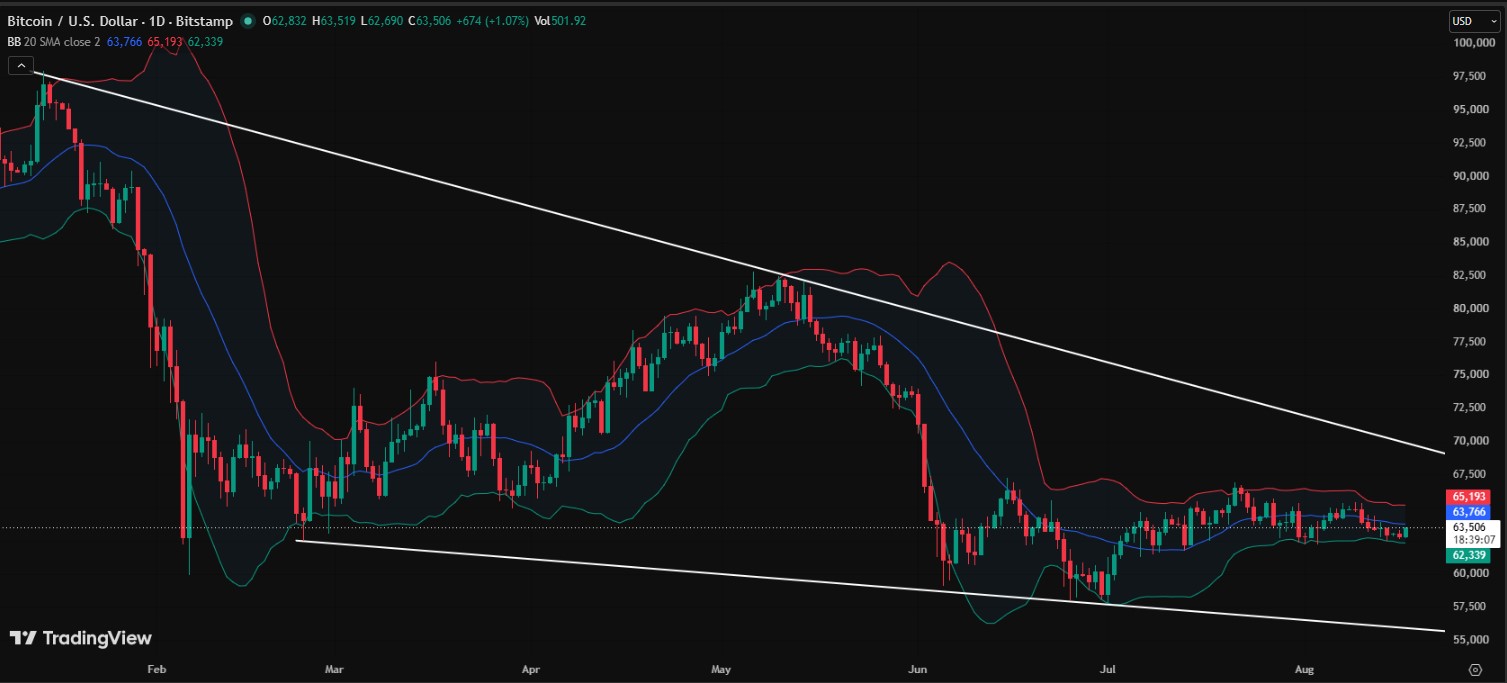
The daily chart shows a falling wedge. Price is consolidating around $63,500 after a few failed pushes toward the top of the range.
Bollinger Bands on the chart are tightening. That usually means a bigger move, up or down, is building underneath the surface.
Resistance sits at $65,000 to $66,000. A daily close above that zone would open the door toward $69,000 to $72,000, with the descending trendline near $75,000 to $80,000 as a further target.
Below $60,000, the picture changes. Losing that support would strengthen the bearish case and put $57,000 to $55,000 back in play.
Is Bitcoin's four-year cycle pointing to an October bottom?
Some traders are watching Bitcoin's rough four-year rhythm of bull and bear phases. Past cycles have shown roughly 1,065-day bull runs followed by about 365-day bear stretches.
If that same rhythm plays out again, the current bear phase could technically wrap up before the end of October. That has pushed a slice of the market to talk about a bottom forming between October 6 and October 16.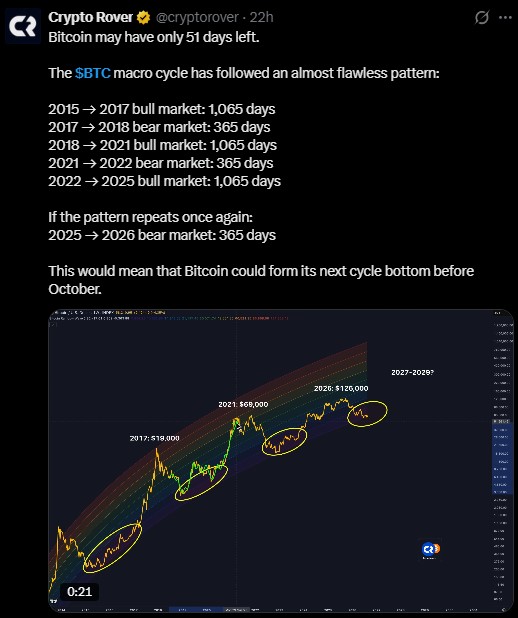
This kind of cycle math is a talking point, not a guarantee. Bitcoin has only existed through a handful of these cycles, so the sample size is small. Macro conditions, regulation, and ETF demand all shift from cycle to cycle too.
Some traders are framing a dollar-cost averaging approach into any drop toward the $48,000 to $62,000 zone as a way to build a position gradually rather than guess the exact low. That is one strategy among many, not financial advice, and it carries real risk if the pattern does not repeat.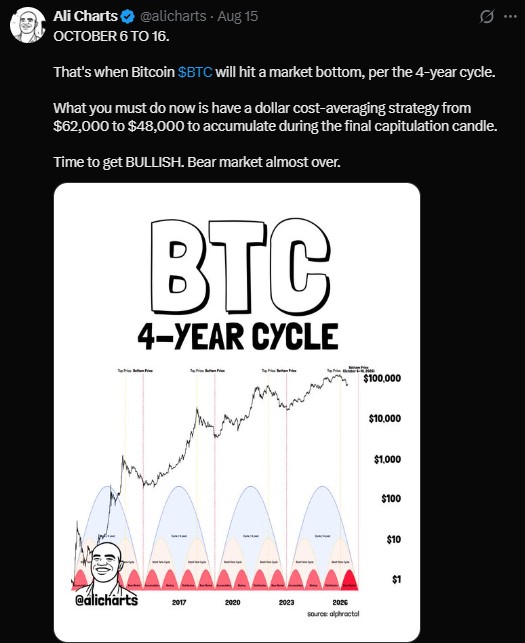
Why are Bitcoin ETFs seeing outflows?
Spot Bitcoin ETFs booked $390 million in net outflows during the week of August 10 to 14. Fidelity's FBTC led the exits with $153 million pulled.
Outflows like this signal that big institutional money is stepping back for now, at least short-term. That lines up with the sideways price action and the softer demand traders have flagged this month.
Weaker ETF demand does not automatically mean a crash is coming. It does suggest conviction is thin at current prices, which is part of why the range has been so tight.
What could move Bitcoin next?
A few things are worth watching over the coming weeks.
A daily close above $66,000 would be the clearest bullish signal on the chart.
A break below $60,000 support would open the door to $57,000 and lower.
ETF flow data each week will show whether institutional demand is returning or fading further.
Broader risk appetite tied to Federal Reserve rate decisions could push BTC in either direction.
Bitcoin price prediction: final take
The near-term picture for Bitcoin is best described as sideways with a bullish lean, but only if $66,000 gives way. Until then, BTC is stuck between buyers who want proof of strength and sellers who keep capping every rally.
The October cycle-bottom idea is worth watching, but it should be treated as one scenario among several rather than a fixed date on a calendar. Price action, not calendar math, will confirm whether a bottom is actually in.
Disclaimer
This article is for informational purposes only and does not constitute financial, investment, or trading advice. Past performance and historical cycle patterns do not guarantee future results. Always do your own research and consult a licensed financial advisor before making investment decisions.
0
0


 Manage all your crypto, NFT and DeFi from one place
Securely connect the portfolio you’re using to start.


0
0

0
0