ORCA price outlook: this pattern shows another breakout is possible

0
0

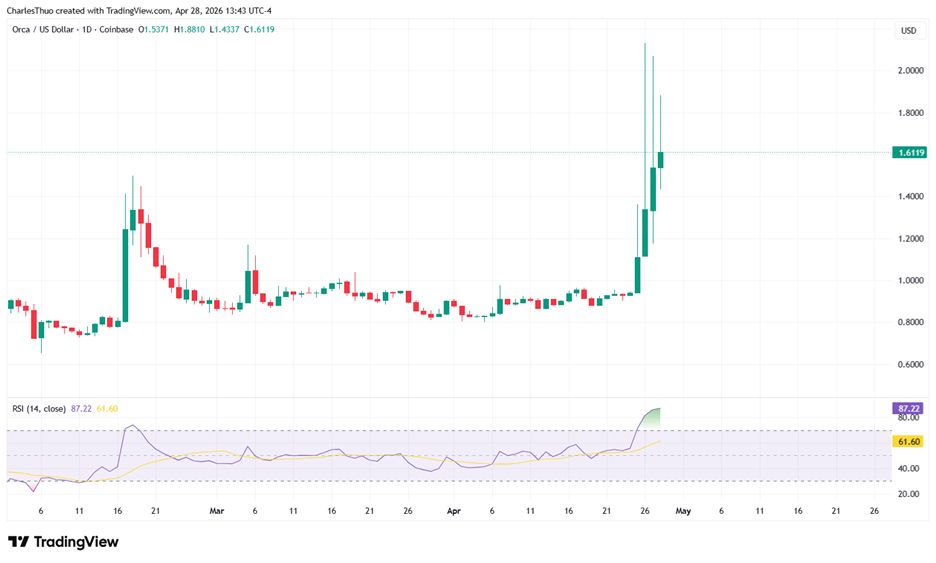
ORCA is trading near $1.61 after a volatile session that saw the token pull back from recent highs and consolidate within a tight short-term range.
Despite today’s drop of 16.2% in the last 24 hours, the broader price structure still shows signs of sustained upward momentum building from April 25.
Recent price action and profit-taking pressure
The latest move in ORCA comes after a rapid expansion phase that saw the token rise by roughly 108% over a one-week period before reaching highs near $1.90.
This sharp upward move was followed by a correction phase, with trading activity showing increased volume of over $380 million in a single day, signalling active distribution after the rally.
Market flow data indicates that part of the earlier rally was driven by strong retail demand from Korean exchanges, particularly Upbit, where buying activity accelerated during the breakout phase.
Once the price extended rapidly, short-term holders began locking in gains, contributing to the current pullback.
At the same time, broader crypto sentiment has been cautious.
The leading cryptocurrency, Bitcoin (BTC), has experienced weakness as US spot Bitcoin ETFs recorded $263 million in outflows, breaking a nine-day inflow streak.
This shift in sentiment ahead of the Federal Reserve policy decision has added pressure on altcoins, including ORCA, which tends to move with higher sensitivity to risk-on and risk-off shifts in the market.
A breakout pattern is forming
Since the breakout on April 25, ORCA has been forming a series of higher lows, even as volatility has increased.
This is a notable change in structure after a prolonged downtrend that followed its decline toward all-time lows earlier in the year.
The most important technical area in the current structure is the demand zone between $1.620 and $1.650.
This zone acted as the launch point for the most recent upward impulse, where ORCA's price moved from approximately $1.450 to near $1.900 without a proper retest.
In technical terms, this creates an unmitigated area of interest where liquidity remains untested.
Currently, ORCA is trading just below this region at around $1.61–$1.65, depending on intraday movement.
The current market structure suggests that if the price breaks above the $1.620–$1.650 area and holds above $1.75, it could serve as a continuation base for the next leg higher.
This setup projects a potential move toward $2.10, which represents an extension of roughly 22% from the demand zone.
However, the RSI on the daily chart is still in the overbought region, meaning the current correction could go on for some time before the next breakout.
And as the price pulls back, market projections show that traders should keep their eyes on the $1.50–$1.55 zone, which is the next major support area to monitor.
The post ORCA price outlook: this pattern shows another breakout is possible appeared first on Invezz
0
0


 すべての暗号通貨、NFT、DeFiを1か所から管理
開始に使用しているポートフォリオを安全に接続します。


