The Graph price prediction 2024-2030: Will GRT reach $10?

0
1

Key takeaways:
- The Graph price prediction anticipates a high of $0.301 by the end of 2024.
- In 2025, it will range between $0.4023 and $0.4740, with an average price of $0.4163.
- In 2030, it will range between $2.53 and $3.18, with an average price of $2.62.
The Graph offers access to competitive and cost-efficient decentralized data sets.
The network boasts a 99.99% uptime and 24/7 availability. Central to The Graph’s operations are subgraphs, APIs that organize and serve blockchain data to data consumers and developers.
The Graph has over 100 indexer nodes, 1.23 trillion served queries, and over 70,000 hosted projects. The GRT token acts as an incentive mechanism for the Graph Network. It incentivizes network participants to provide data to end users and organize it effectively.
So, how high will GRT go? Is it a good investment? What will be its price in 2025? The following sections explore these questions and more.
Overview
| Cryptocurrency | The Graph |
| Ticker | GRT |
| Current price | $0.1881 |
| Market cap | $1,796,658,787 |
| Trading volume | $48,569,107 |
| Circulating supply | 9,548,531,509 |
| All-time high | $2.88 on Feb 12, 2021 |
| 24-hour high | $0.1916 |
| 24-hour low | $0.1795 |
The Graph price prediction: Technical analysis
| Metric | Value |
| Volatility (30-day variation) | 11.08% |
| 50-day SMA | $0.253 |
| 200-day SMA | $0.259 |
| Sentiment | Bearish |
| Fear and green index | 28 (Fear) |
| Green days | 12/30 (40%) |
The Graph price analysis: GRT drop slows
- GRT movement contrasts its bullish run in the first quarter of 2024.
- The RSI is neutral territory, so there is plenty of room for price movement in either direction.
The Graph 1-day chart: GRT faces rejection at $0.213
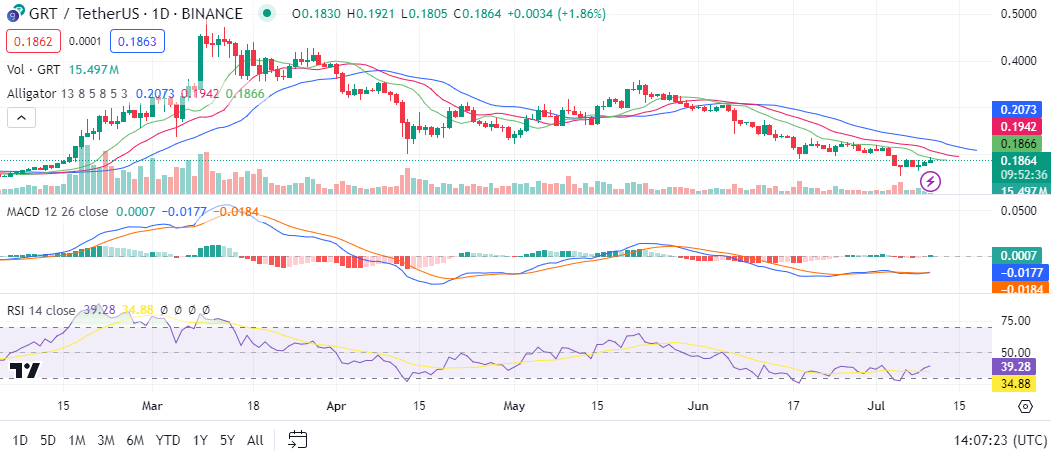
The Graph price analysis for July 7, 2024. GRT movement contrasts its bullish run in the first quarter of 2024. The difference is the rate at which the price changed. In the second quarter, the coin assumed a gradual bear run. It has so far dropped by 50% from the annual high.
GRT’s downward trend comes as it faces rejection at $0.213. The current decline is gradual, and the little momentum indicated by the MACD suggests the drop is slowing some more. Volatility has remained unchanged for the last three weeks, and the relative strength index is in neutral territory.
The Graph 4-hour chart: GRT recovers from oversold territory
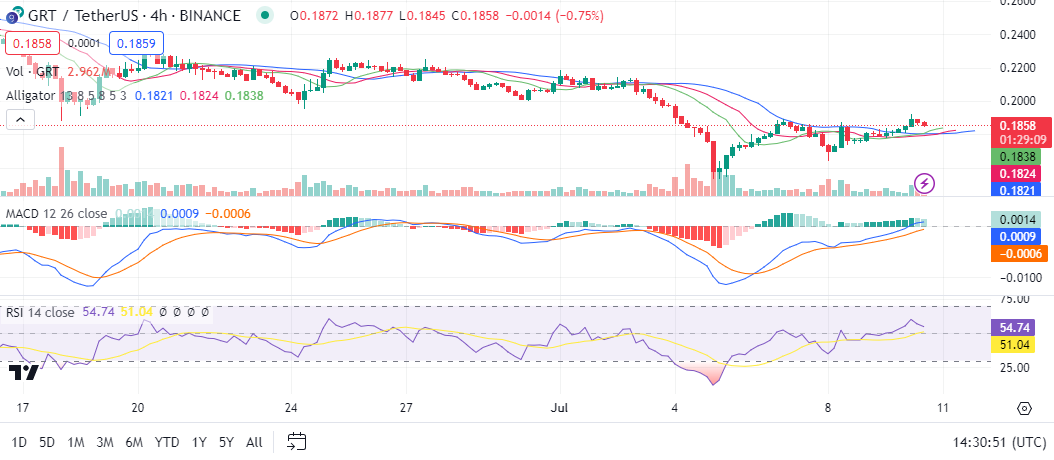
The 4-hour chart highlights GRT’s drop into oversold territory and the preceding reversal. At the time, GRT fell from $0.214 to $0.153. It then reversed to a high of $0.188. The coin’s bear run prevented it from rising to previous highs; despite this, it continues to register positive momentum. The RSI is neutral territory, so there is plenty of room for price movement in either direction.
The Graph technical analysis: Levels and action
Daily simple moving average (SMA)
| Period | Value ($) | Action |
| SMA 3 | 0.1956 | SELL |
| SMA 5 | 0.1880 | SELL |
| SMA 10 | 0.1932 | SELL |
| SMA 21 | 0.2091 | SELL |
| SMA 50 | 0.2529 | SELL |
| SMA 100 | 0.2726 | SELL |
| SMA 200 | 0.2589 | SELL |
Daily exponential moving average (EMA)
| Period | Value ($) | Action |
| EMA 3 | 0.2023 | SELL |
| EMA 5 | 0.2073 | SELL |
| EMA 10 | 0.2143 | SELL |
| EMA 21 | 0.2300 | SELL |
| EMA 50 | 0.2568 | SELL |
| EMA 100 | 0.2685 | SELL |
| EMA 200 | 0.2505 | SELL |
Is The Graph a good investment?
The Graph rivals some Web2 data oracles for its efficiency and low costs. GRT, its native token, however, remains a victim of general market dynamics and high volatility. The current sentiment is bearish, with predictions pointing to higher price growth.
What can we expect from GRT price analysis next?
Per our analysis, the current sentiment is bearish, while the Fear & Greed Index shows investors are fearful. The charts show GRTs drop is slowing over the short term.
Why is GRT down?
The Graph is trading at its lowest this year, the crypto market capitalization is also at its lowest. The drop in the Graph’s value could be attributed to the general bearish market sentiment.
Will GRT recover?
The Graph recovered from the months drop, but is yet to recover to previous highs. GRT will recover to previous highs when the general market sentiment changes.
Will GRT reach $1?
Yes, GRT should rise above $1 in 2027. In that year the price will range between $0.8744 and $1.03.
WIll GRT reach $10?
Per the Cryptopolitan price prediction, it remains highly unlikely that GRT will get to $10 before 2030.
WIll GRT reach $100?
Per the Cryptopolitan price prediction, it remains highly unlikely that GRT will get to $100 before 2030.
Does GRT have a good long-term future?
Per the Cryptopolitan price predictions, GRT is set to trade higher in years to come. However factors like market crashes or difficult regulations could invalidate the bullish theory.
Recent news/ opinions
The Graph now offers enhanced Web3 data experiences with features like ultra-fast syncing and reliable uptime, all underpinned by decentralization. It supports over 50 chains and 6,000+ subgraphs and is trusted by thousands of dapps and teams, ensuring developers have a scalable and dependable data layer.
The Graph price prediction July 2024
A break above resistance is critical to ending The Graph’s bear run this month. The price will range between $0.1697 and $0.2523 and average at $0.1924.
| Month | Potential low ($) | Potential average ($) | Potential high ($) |
| July | 0.1697 | 0.1924 | 0.2523 |
GRT price prediction 2024
As the third quarter of 2024 unfolds, GRT will likely recover to previous highs. The coin will trade between $0.1697 and $0.3010. The average price will be $0.2810
| Year | Potential low ($) | Potential average ($) | Potential high ($) |
| 2024 | 0.1697 | 0.2810 | 0.3010 |
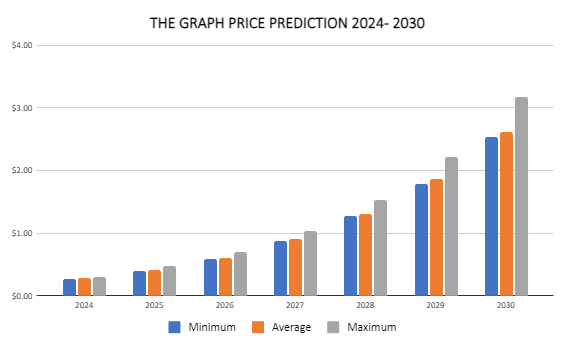
GRT price prediction 2025-2030
| Year | Potential low ($) | Potential average ($) | Potential high ($) |
| 2025 | 0.4023 | 0.4163 | 0.4740 |
| 2026 | 0.5900 | 0.6108 | 0.7022 |
| 2027 | 0.8744 | 0.9050 | 1.03 |
| 2028 | 1.27 | 1.31 | 1.53 |
| 2029 | 1.79 | 1.86 | 2.21 |
| 2030 | 2.53 | 2.62 | 3.18 |
The Graph price prediction 2025
The Graph price forecast for 2025 sets the high at $0.474. However, in the case of a market correction, the GRT price will rest at a minimum of $0.4023 and an average of $0.4163.
The Graph price prediction 2026
The year 2026 will experience more bullish momentum. As per the Graph GRT price prediction, it will range between $0.59 and $0.7022, with an average trading price of $0.6108.
The Graph price prediction 2027
The Graph prediction climbs even higher into 2027. According to the prediction, it will range between $0.8744 and $1.03, with an average price of $0.9050.
The Graph GRT price prediction 2028
The analysis suggests a further acceleration in GRT’s growth by 2028. As per the GRT price prediction, the price of The Graph will range between $1.27 and $1.53, with an average of $1.31.
The Graph price prediction 2029
According to the GRT price prediction for 2029, GRT’s price will reach a maximum and minimum of $2.21 and $1.79, respectively, with a year-round average of $1.86.
GRT price prediction 2030
The Graph for 2030 suggests a price range of $2.53 and $3.18 and an average price of $2.62. This long-term prediction hinges on GRT’s rising global adoption and recognition. Demand surges as more users and systems incorporate the GRT token, increasing its value.
The Graph Market price prediction: Aalysts GRT price forecast
| Platform | 2024 | 2025 | 2026 |
| Digitalcoinprice | $0.38 | $0.45 | $0.67 |
| Changelly | $0.41 | $0.39 | $0.57 |
| Gate.io | $0.26 | $0.28 | $0.29 |
Cryptopolitan’s GRT price prediction
Our predictions show that GRT will achieve a high of $0.3010 in the second half of 2024. In 2025, it will range between $0.403 and $0.4740, with an average of $0.4163. In 2030, it will range between $2.53 and $3.18, with an average price of $2.62. Note the predictions are not investment advice. Seek independent professional consultation or do your research.
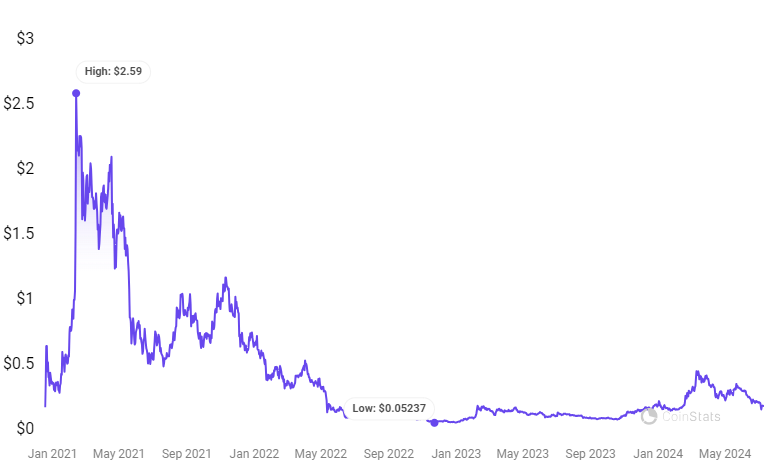
The Graph historic price sentiment
- Yaniv Tal, Brandon Ramirez, and Jennus Pohlman launched The Gaph on the Ethereum blockchain in 2018.
- In June 2020, The GRaph held its private token sale, raising $5 million. Some participants included Multicoin Capital, Digital Currency Group, and DTC Capital.
- The public sale, which took place in October 2020, raised $12 million. Each token sold for $0.03. The mainnet launched in December 2020.
- In January 2021, another sale led by Tiger Global Management raised $50 million.
- Looking back, GRT had its best performance in 2021, when it registered its all-time high at $2.88 on February 12, 2021.
- In Feb 2022, venture capital firms DCG, Milticoin Capital, NGC ventures, Gumi Cryptos Capital, and Hashkey announced the launch of a $205 million ecosystem fund, The Graph Protocol.
- In preceding years, GRT consistently traded below $0.7. In 203, it fell below $0.2.
- It started recovering in 2024, breaking above $0.4 at its highest, reaching $0.45 in March. It later corrected, and in July, it fell below $0.20.
0
1

 Manage all your crypto, NFT and DeFi from one place
Securely connect the portfolio you’re using to start.