
Aurora Price Prediction 2026: Can $AURORA Hold the Breakout?

0
0
AURORA, the governance token of the Aurora network built on NEAR, just pulled off a sharp descending channel breakout. This Aurora price prediction 2026 report checks the data before getting excited. For deeper context, a related Aurora resistance reclaim analysis covers how the token behaved before this move started.
Momentum looks real. Volume backs it up, mostly. But RSI is flashing a warning that traders shouldn't skip.
Aurora Price Prediction Snapshot
Numbers below reflect the live data snapshot taken around 18:00:03 UTC on September 23, 2026, pulled from CoinMarketCap, Etherscan, and TradingView charts.
Metric | Data |
Current price | $0.0831 |
24H change | +55.2% (CoinMarketCap 24H rolling high $0.1327, low $0.0541) |
Market cap | $61.52M |
24H volume | $39.35M |
Circulating supply | 738.07M AURORA |
RSI (Daily) | 80.92 |
Trend | Bullish structure, momentum overheated |
Support | $0.043 zone |
Resistance | $0.138 zone |
Next target | $0.138, conditional on volume holding |
Turns out, the day's candle tells two stories at once. Price ran to $0.107 intraday, then faded toward $0.083, down 14.58% from that high on the daily candle itself.
What Is Aurora and Which AURORA Token Is This?
Aurora on NEAR Explained
Aurora is an EVM-compatible environment, meaning it runs Ethereum-style smart contracts, built on top of the NEAR blockchain. $AURORA is the network's governance token, and its contract data on Etherscan's token tracker lists a maximum supply of 1 billion tokens.
This matters because several tokens share similar names across chains. This report covers the $AURORA token native to the Aurora/NEAR ecosystem, not any unrelated Aurora-branded asset.
$AURORA Token Supply and Utility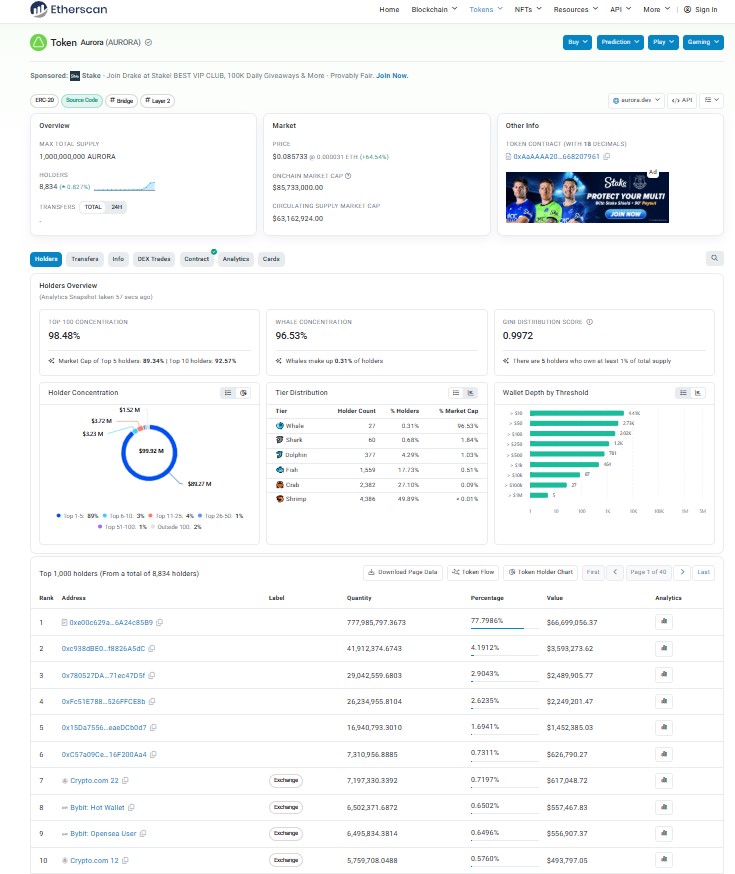
Total supply sits at 999.73M AURORA against a 1 billion cap, with 738.07M AURORA already circulating. That leaves a meaningful gap between circulating and max supply.
Holders on-chain number 8,834 addresses. Concentration is heavy, though. Top 10 holders control 92.57% of the supply, and the top 5 alone hold 89.34%. That's whale territory.
Unlike many low-float presale tokens that launch thin and pump on nothing, $AURORA already carries years of trading history and real holder data, visible on pages tracking new crypto presale and ICO listings for comparison.
Why Is $AURORA Price Moving Now?
This wasn't a slow grind. The price jumped over fifty percent in a single trading day.
Volume exploded too. Daily volume hit $39.35M, up 190.7% against the prior session. The Vol/Mkt Cap ratio reached 62.09%, an unusually high figure for a mid-cap token.
And it lines up with a fresh product announcement. Aurora Intents went live on Turbo Swap, letting users swap major assets into $TURBO without bridging, as confirmed on X.
Liquidity followed the news. Unlocked market cap sits at $81.66M versus a total market cap of $61.52M, a gap that shows real float moving alongside the announcement, per the live CoinMarketCap price tracker.
Broader market conditions matter here too. When BTC and ETH hold steady, mid-cap tokens like $AURORA get more room to run on their own catalysts. When they don't, altcoins usually get dragged down regardless of local news, a pattern covered often across AI-related crypto market news.
Fine. The catalyst is real. But a fifty percent daily spike rarely holds without a cooldown first.
$AURORA Technical Analysis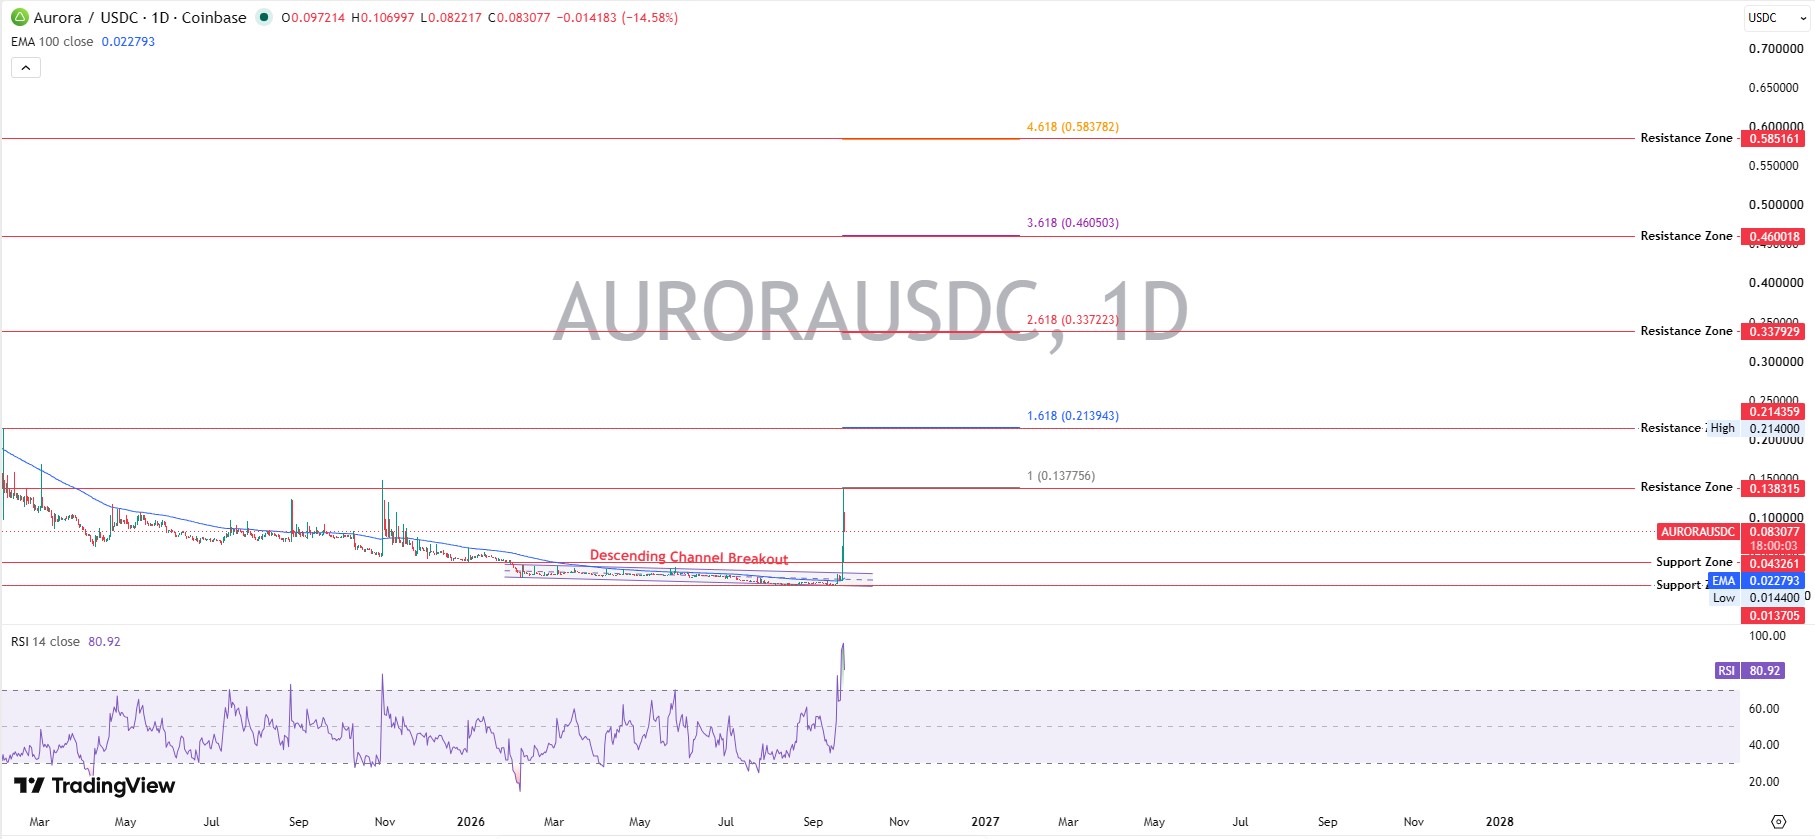
$AURORA Trend and Market Structure
$AURORA spent most of 2025 sliding lower inside a falling channel, grinding from roughly $0.10 down toward $0.014 by mid-2026. That's a brutal stretch.
Then the breakout hit. Price cleared the descending channel's upper boundary near $0.043 and ran straight through $0.10, confirmed on the daily AURORA/USDC chart tracked on Coinbase.
Distance from the breakout point now stands wide. Price trades roughly double the breakout zone, which is exactly the kind of extension that invites a pullback before any continuation.
RSI and Momentum
RSI, or Relative Strength Index, measures how fast and how far price has moved, on a scale of zero to 100. Above 70 usually signals overbought conditions.
AURORA's daily RSI sits at 80.92. That's deep overbought territory, well past the usual warning line.
Does that mean the rally is over? Not automatically, but it does mean risk of a sharp reversal is elevated right now.
Volume Confirmation
Volume is what separates a real breakout from a fake one. AURORA's $39.35M daily volume, up 190.7% day over day, backs the move with real participation rather than thin order books.
But sustained breakouts need volume to stay elevated for several sessions, not just one. One outsized candle doesn't prove the structure has changed for good.
Traders watching liquidity depth can track live pairs through exchange listing data to confirm whether volume holds up over the coming week.
MACD and Moving Averages
MACD, or Moving Average Convergence Divergence tracks momentum by comparing two moving averages. AURORA's MACD line sits at 0.0126, well above its signal line at 0.0046, with a positive histogram of 0.0080.
That's a bullish crossover, confirmed. The 100-day EMA (exponential moving average) sits far below the current price, near $0.0228, showing just how stretched this move already is.
$AURORA Support and Resistance Levels
Key Support Levels
Support 1 sits near $0.043, the old channel ceiling that now needs to hold as a floor. Support 2 lies around $0.0144, matching the prior EMA base.
Major support runs deeper, near $0.0137, the session low and a level tied to months of prior consolidation.
Key Resistance Levels
Resistance 1 sits at $0.138, marked by TradingView's Fibonacci extension as the 1.0 level. Resistance 2 comes in at $0.214, the 1.618 extension zone.
Major resistance stands far higher, near $0.338 and eventually $0.460, extensions that only come into play if the current trend extends for months, not days.
Aurora Price Prediction 2026
Bull Case
If the breakout holds above $0.043 and volume stays elevated across multiple sessions, $AURORA could grind toward the $0.138 resistance zone by year end. This needs continued catalyst flow, like further Aurora Intents integrations, and a broadly supportive BTC and ETH market.
Base Case
Momentum cools, RSI resets from overbought, and price consolidates somewhere between $0.05 and $0.09. Support around $0.043 holds through the noise. This is the most statistically common outcome after a spike this sharp, based on how $AURORA behaved after prior volume surges.
Bear Case
The breakout fails, the price falls back under $0.043, and volume dries up fast. Combined with a weaker broader market, $AURORA could retest the $0.0137 major support zone.
Invalidation Levels
The bullish setup breaks down specifically if daily trading closes below $0.043 on rising volume for two consecutive sessions. That would signal the breakout was a trap, not a trend change.
A move back under $0.0228, the 100-day EMA, would invalidate the mid-term bullish structure entirely, not just the short-term breakout.
Aurora Price Prediction 2027–2030
Long-range figures below come from target market cap divided by projected circulating supply, not from picking a price first.
Year | Bear Case | Base Case | Bull Case | Main Driver |
2027 | $0.02–$0.04 | $0.06–$0.10 | $0.15–$0.22 | Adoption and liquidity depth |
2028 | $0.03–$0.05 | $0.09–$0.14 | $0.22–$0.34 | Ecosystem growth on NEAR |
2029 | $0.03–$0.06 | $0.12–$0.20 | $0.30–$0.46 | Cross-chain intents activity |
2030 | $0.04–$0.07 | $0.15–$0.25 | $0.40–$0.58 | Network revenue and usage |
These are scenario ranges, not guarantees. Token unlocks tied to the 1 billion max supply cap could pressure any of these outcomes if release schedules accelerate, a factor worth tracking on the crypto airdrops and unlocks tracker.
Exactly how fast supply unlocks against demand growth will decide which column in that table ends up closest to reality.
Disclaimer
This article is for informational purposes only and does not constitute financial, investment, or trading advice. Cryptocurrency markets are highly volatile, and prices can change rapidly. Figures cited come from a specific data snapshot and may not reflect current market conditions. Readers should conduct independent research and consult a qualified financial advisor before making any investment decisions.
0
0


 Manage all your crypto, NFT and DeFi from one place
Securely connect the portfolio you’re using to start.


