HBAR Price Faces The End Of A 2-Month-Long Golden Cross, What’s Next?

0
0
Hedera (HBAR) has struggled to maintain bullish momentum despite recent attempts at recovery. The altcoin is facing increased bearish pressure, leading to a prolonged drawdown.
The question that now arises is whether the decline could extend further, as technical indicators signal potential weakness in the coming weeks.
Hedera Notes Inflows
The Chaikin Money Flow (CMF) suggests investors are still showing interest in HBAR, with the indicator trending upward. This reflects fresh inflows of capital into the asset despite market uncertainty. A rising CMF often signals that buyers are attempting to counteract broader selling pressure in the market.
Rob Allen, Director of HEAT at Hashgraph, stated that the crypto sector is heading toward an “explosion of digital currencies and the use cases that support them.” His outlook highlights optimism for HBAR’s long-term potential.
Want more token insights like this? Sign up for Editor Harsh Notariya’s Daily Crypto Newsletter here.
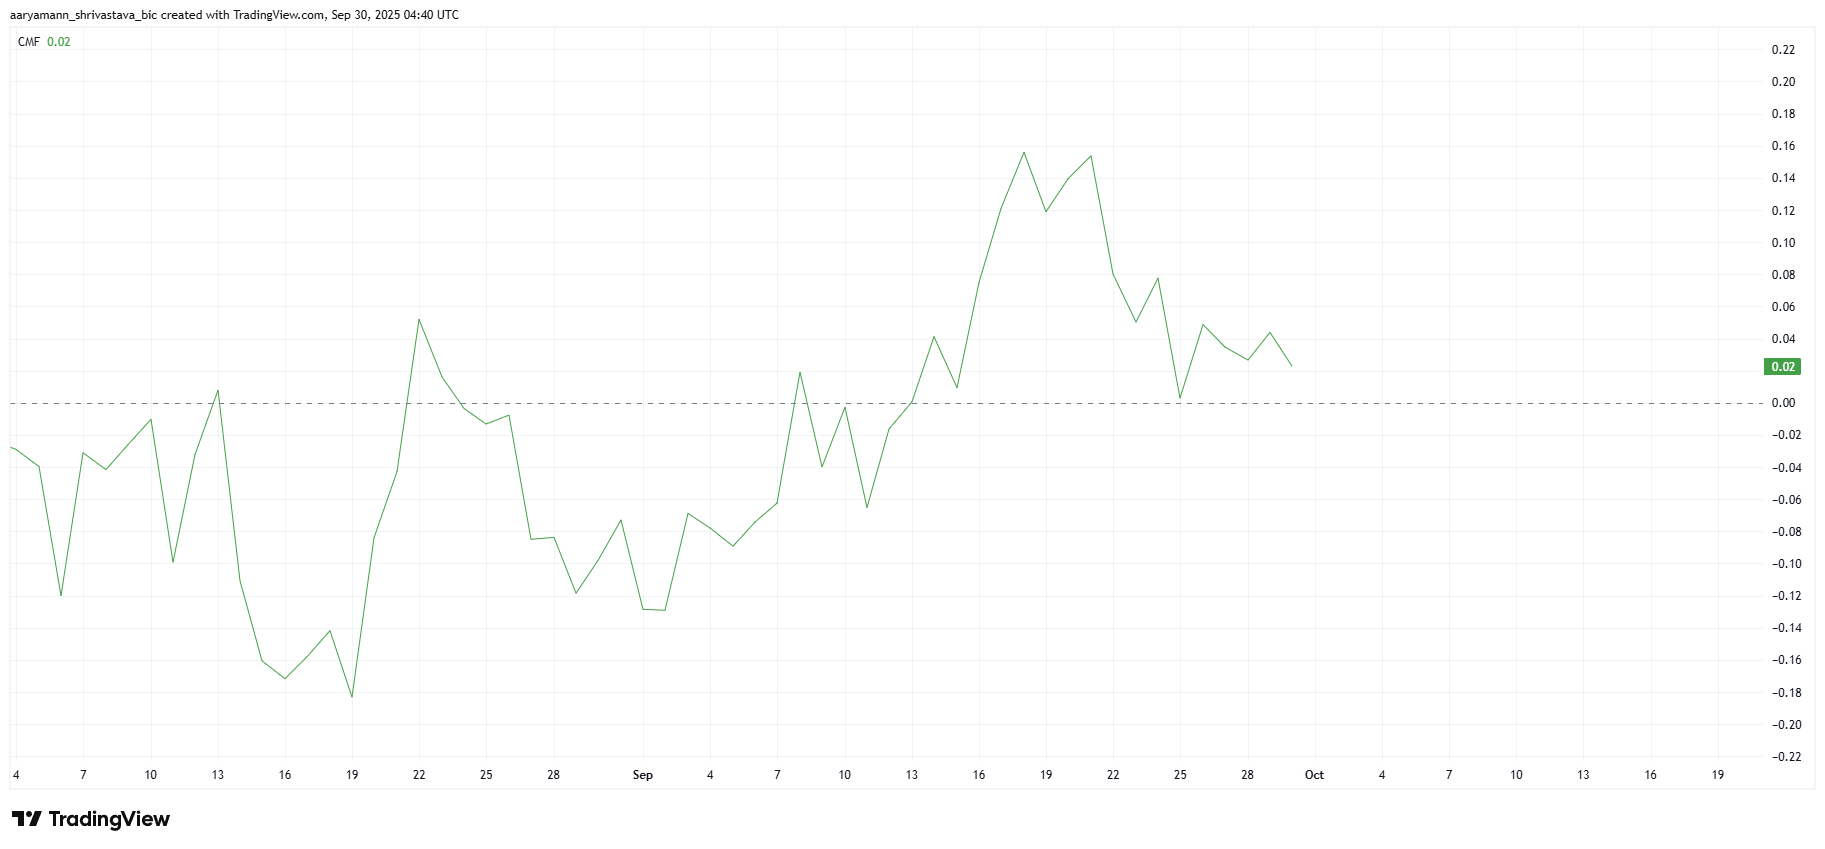 HBAR CMF. Source: TradingView
HBAR’s long-term momentum appears fragile as exponential moving averages (EMAs) converge. After nearly two months of a bullish crossover, the gap between the 50-day EMA and the 200-day EMA is narrowing again. This shift could indicate that the prevailing uptrend is weakening under renewed bearish pressure.
If the 200-day EMA moves above the 50-day EMA, HBAR would enter a Death Cross, a widely watched bearish signal. Such a development could accelerate selling pressure. With the bullish crossover at risk of ending, Hedera’s market structure remains vulnerable.
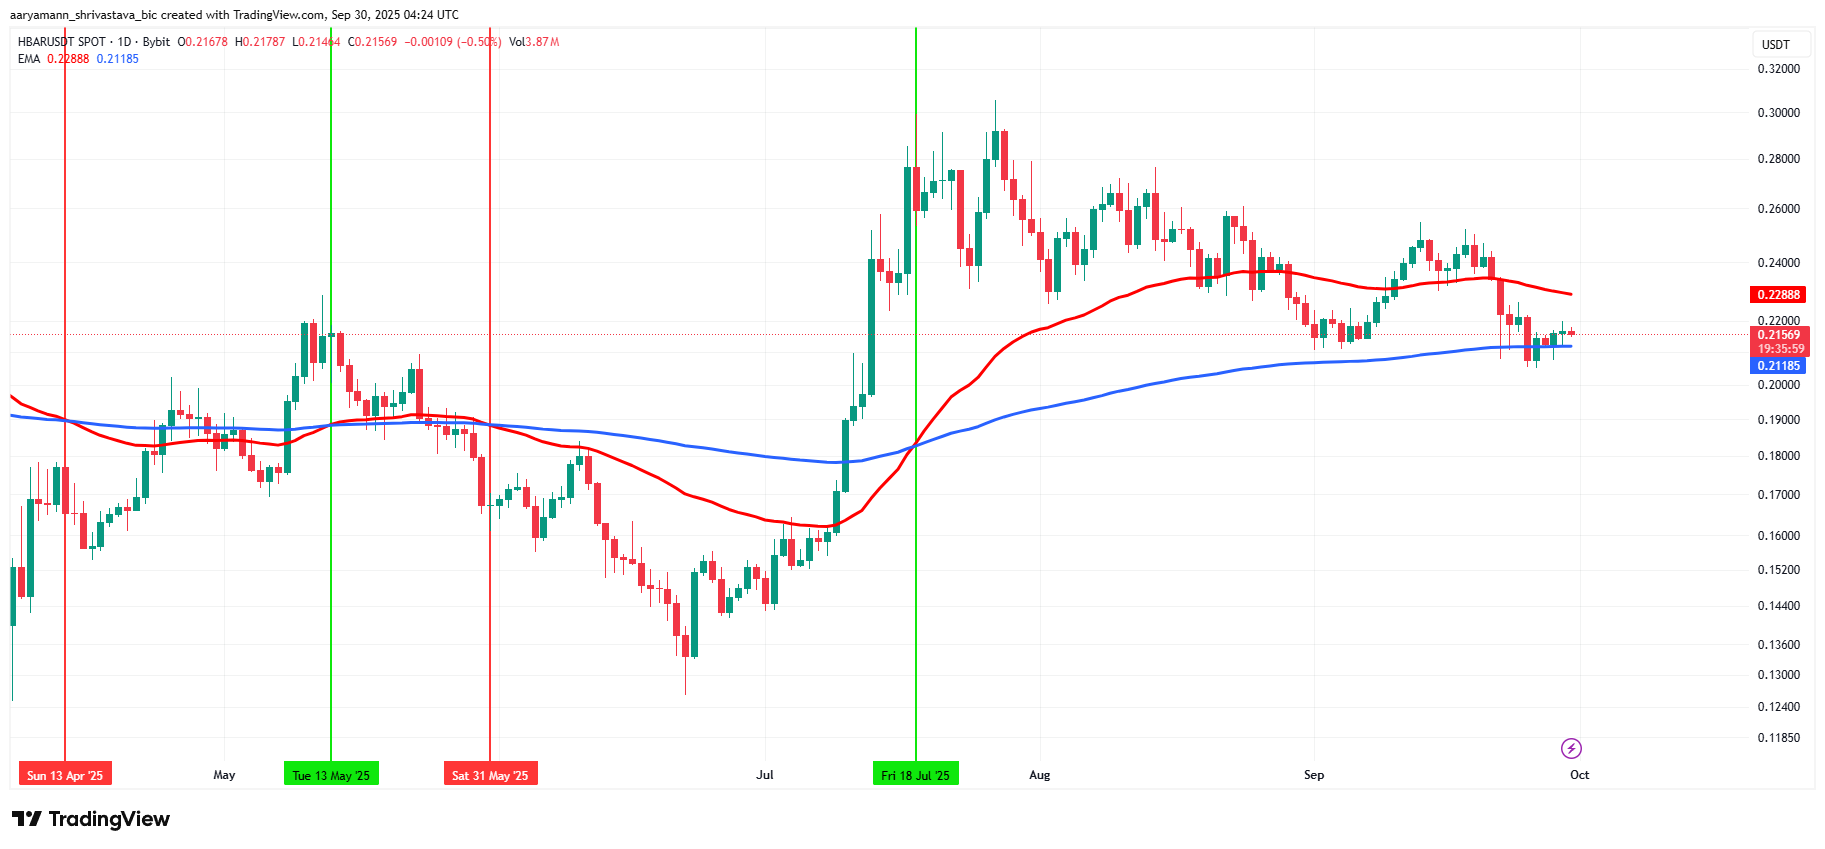 HBAR EMAs. Source: TradingView
HBAR Price May Struggle
HBAR’s price currently trades at $0.215 within a descending wedge pattern. It sits just above support at $0.213 while struggling to break $0.219 resistance. Although wedges often resolve positively, a decisive breakout remains distant, with the key barrier standing near $0.230.
Given current sentiment and technical indicators, HBAR is likely to stay range-bound below $0.230. Even if the price surpasses $0.219, broader resistance and limited momentum could keep the altcoin consolidated.
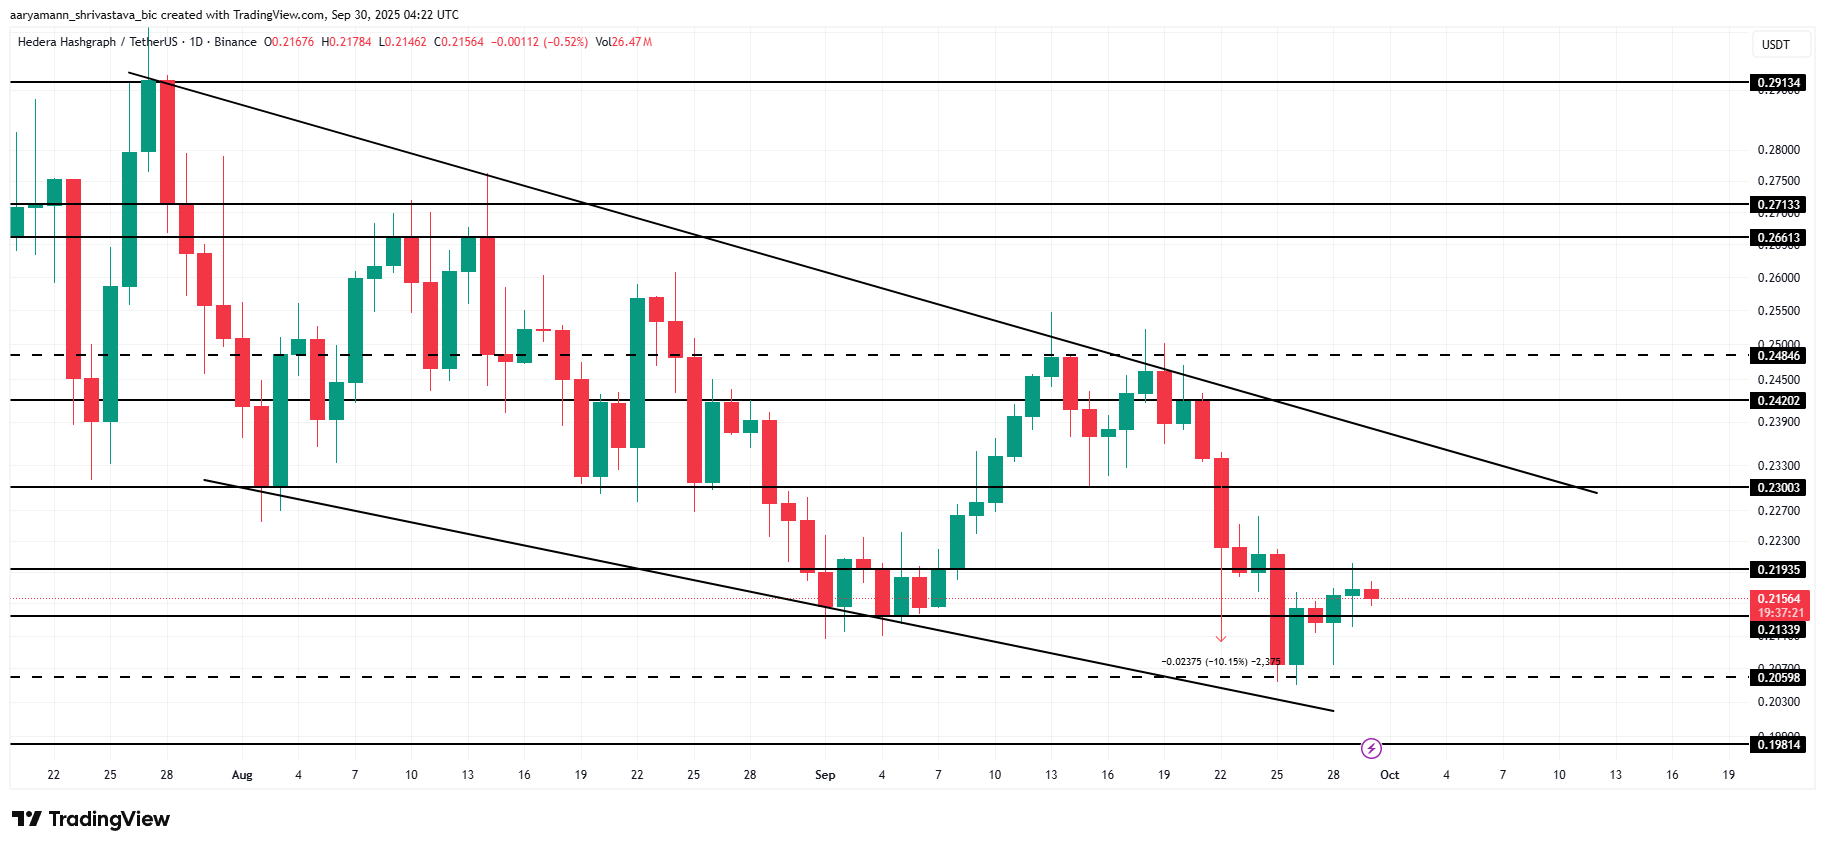 HBAR Price Analysis. Source: TradingView
Should bearish signals strengthen, HBAR risks slipping through support at $0.205. Breaking this level would invalidate the bullish setup entirely, opening the path to $0.198. Such a move could reinforce investor caution and intensify Hedera’s short-term volatility.
0
0


 Manage all your crypto, NFT and DeFi from one place
Securely connect the portfolio you’re using to start.


0
0