What coins are in high demand right now? A practical guide

0
0

Use this article as a starting framework. It outlines quick checks, weekly monitoring steps and common pitfalls so you can separate short-lived spikes from sustained user interest.
What ‘coins market’ demand means: definition and context
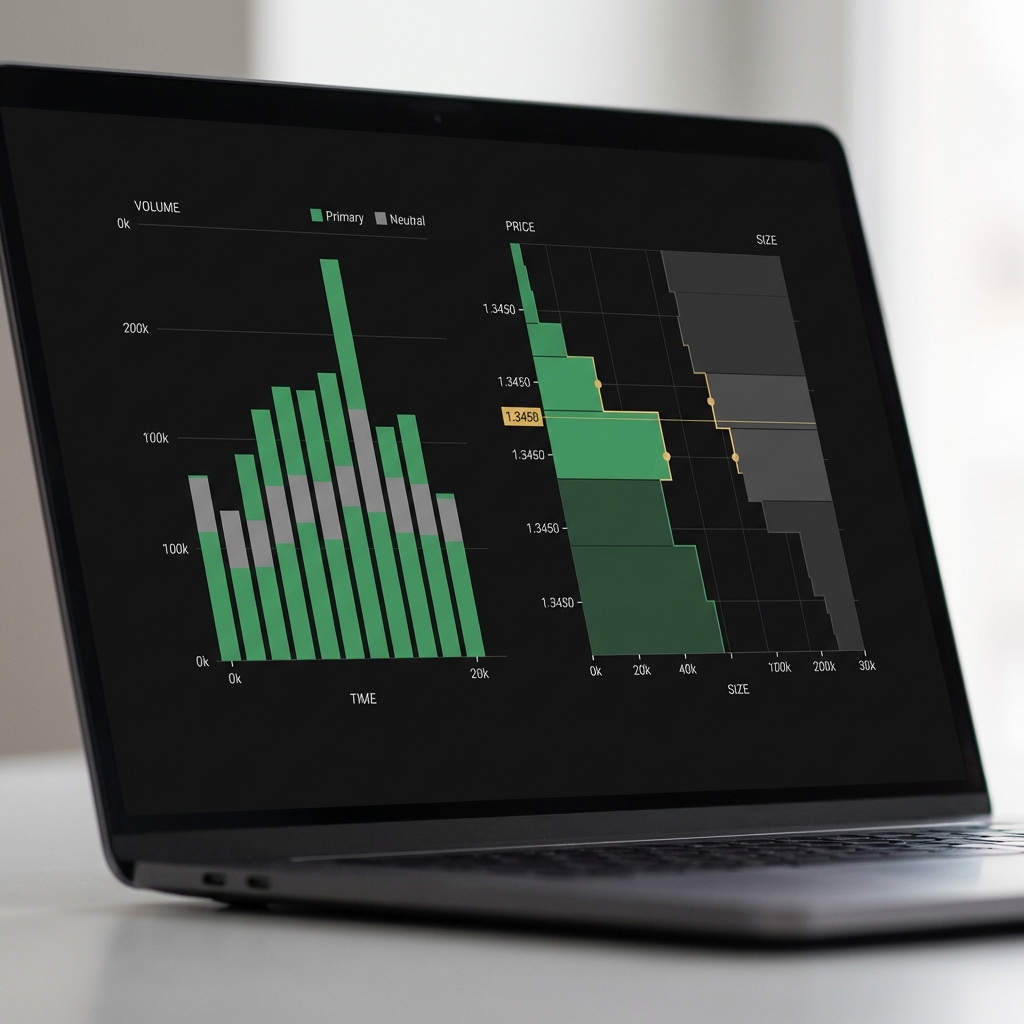
When people ask which coins are in high demand right now, they often mean more than price moves. The term coins market demand refers to measurable interest that comes from trading activity and real usage, not a single-day price jump. Practical measures include spot trading volume, order-book depth and on-chain transfer activity, which together give a clearer picture than price alone.
On-chain transfer volume and the number of active addresses tend to reflect user behaviour such as transfers, payments, or growing custody, while spot trading volume and liquidity show whether buyers and sellers can transact without large price impact. Analysts now treat these signals together to reduce the noise from short-term events, and this combined view is commonly recommended in on-chain research Glassnode guide to on-chain metrics. See also Altrady guide to on-chain metrics.
Partner with FinancePolice for sponsored content and audience reach
This checklist approach below is a starting point you can use to separate short-lived buzz from stronger, persistent demand.
Why defining demand matters for everyday investors
For everyday investors, understanding demand helps set expectations. A one-day price surge can feel like a clear signal, but it may be a news-driven spike that reverses. Demand measured across trading and on-chain indicators can help you decide whether to add a coin to a watchlist or simply note a temporary event.
Thinking in terms of demand also clarifies risk. Low liquidity can make it hard to enter or exit positions without moving the market, and shallow order books increase execution risk even when headlines look positive.

Difference between price moves and user-driven demand
Difference between price moves and user-driven demand
Price moves are the market’s result, not a direct measure of user interest. A rising price can be caused by small, concentrated orders or derivatives activity that is not observable on-chain. In contrast, rising transfer volume and more active addresses usually signal broader user engagement, which is often a higher-confidence sign of demand Glassnode guide to on-chain metrics.
No single metric is definitive; demand is best judged with spot data, order-book measures and on-chain trends combined. Using multiple signals reduces the chance of mistaking short-lived hype for sustained adoption.
Key metrics used to measure demand in the coins market
Spot trading volume: what it shows and its limits
Spot trading volume records how much of a coin changes hands on exchanges over a given period. A steady, elevated volume over days can indicate rising interest from real traders, while a single-day spike often follows listings or news and may not persist. Analysts caution that spikes tied to announcements should be checked for persistence before drawing conclusions Crypto Market Report 2024.
Spot volume is easy to view but can be noisy. It is useful as a near-term signal, especially when paired with liquidity checks and on-chain trends.
Order-book depth and liquidity measures
Order-book depth describes how much quantity is available at prices near the current market rate. Deeper order books let larger orders execute without large price moves, which makes a coin more tradeable. Liquidity measures matter for practical trading decisions because thin books can cause slippage and increase execution costs.
When checking liquidity, look at bid-ask spreads and cumulative depth within a reasonable percentage band of the mid price. These snapshots show how much buying or selling pressure the market can absorb before the price moves significantly.
On-chain transfer volume counts value moved between addresses and can capture real user activity such as payments, exchanges between wallets, or large custody transfers. Active-address growth counts unique sending or receiving addresses and tends to indicate more users interacting with the network. Together, these measures are often treated as more reliable user-demand signals than price alone On-chain indicators and market demand. See also Nansen coverage of key on-chain metrics.
Staking inflows and changes in TVL on Layer 1 and Layer 2 networks capture different kinds of demand, such as interest in earning rewards or using decentralized applications, and they can complement transfer and address metrics when evaluating broader adoption trends.
How to combine spot, order-book, and on-chain data: a practical framework
A multi-metric checklist you can apply
Instead of relying on a single number, use a checklist that looks at recent spot volume, a simple liquidity snapshot, and multi-day on-chain trends. Start with the last 24 to 72 hours of spot volume to detect immediate activity, then check whether order-book depth supports larger trades, and finally review whether active addresses and transfer volume have risen over several days.
Persistent changes across these areas increase confidence that demand is real. If only one metric moves, treat the result cautiously and look for corroborating signals before changing a position Glassnode guide to on-chain metrics.
Weights and simple rules-of-thumb for retail researchers
A simple weighting approach can help. Give extra weight to persistent on-chain trends such as sustained active-address growth and multi-day transfer volume increases, moderate weight to order-book liquidity, and lower weight to single-day spot spikes. This reflects how researchers commonly prioritize signals to avoid overreacting to transient noise.
Also keep in mind that derivatives and OTC flows may not appear in public on-chain or exchange feeds. Treat them as an open data gap and flag when large off-chain activity could change the picture State of Crypto Market Structure 2025.
Use the checklist repeatedly and update weights based on the coin’s size and market structure. For smaller tokens, liquidity and order-book depth should carry more weight because on-chain transfer volume can be dominated by a few addresses.
Check coherence across spot volume, order-book liquidity and on-chain metrics. If multiple measures rise and the change persists over several days, confidence that demand is real increases. Treat single-day spikes without on-chain corroboration as provisional.
Short-term vs sustained demand signals in the coins market
How to spot fleeting volume spikes
Fleeting volume spikes often coincide with exchange listings, major announcements, or coordinated social attention from crypto influencers. These events can produce dramatic short-term volume without broader network activity. Checking whether active addresses or transfer volume move in step helps determine if the spike reflects real user interest or headline-driven trading Crypto Market Report 2024.
When you see a spike, ask if the activity spreads across many wallets and persists beyond the news window. If not, the spike may be temporary and prone to reversal.
What sustained demand looks like on-chain and on exchanges
Sustained demand tends to show persistent increases in spot volume across several days or weeks, accompanied by rising active-address counts and steady transfer volume. In many cases, staking inflows or growing TVL on a Layer 1 or Layer 2 network appear as parallel evidence that users are engaging beyond trading CoinMetrics state of the network. See our Bitcoin price analysis for examples of demand persistence and related market moves.
Analysts commonly look at 7 to 30 day windows to judge persistence. Shorter windows are useful for immediate monitoring, but longer windows reduce the risk of mistaking temporary events for adoption trends.
When institutional flows change demand rankings
How ETF and custodial flows can dominate short-term demand
Institutional product flows such as ETF inflows and large custodial movements can materially influence which coins appear most in demand, especially for large-cap assets. During periods of significant fund flows, exchange and custody reports may show activity that outpaces retail on-chain signals, changing demand rankings temporarily Digital Asset Management Review H1 2025.

What retail researchers should watch for during big fund flows
Retail researchers should compare exchange inflow/outflow reports with on-chain transfer and active-address trends. If exchange custody figures spike but on-chain active addresses do not, the change may be driven mainly by institutional flows rather than increased user adoption.
Be aware that institutional flows can be transient and tied to reporting cycles or product launches. Cross-checking multiple sources helps determine whether a change is lasting or short-term.
Data gaps: derivatives, OTC trades and ranking limitations
Why some demand is invisible on public feeds
Derivatives and OTC trades are examples of demand that can be hard to observe in public feeds. Large activity in these venues can move markets without producing obvious on-chain signals, which introduces uncertainty when ranking coins solely by spot and on-chain data State of Crypto Market Structure 2025.
This invisibility means rankings should be treated as provisional when there is evidence of heavy off-chain trading or derivatives pressure.
How to account for unobserved flows in your assessment
To reduce the impact of unseen flows, use multiple independent data sources and look for corroborating patterns. For example, confirm large exchange inflows with exchange custody reports and check whether on-chain transfer volume and active addresses also increase. When the signals disagree, raise the uncertainty level in your assessment On-chain indicators and market demand.
Document the data gaps that matter for a given coin and treat any ranking as provisional if large off-chain activity is plausible.
Practical checklist: step-by-step to spot high-demand coins
Quick checks you can do in 10 minutes
Use a short, time-boxed routine for quick signals. Check 24 to 72 hour spot volume, a snapshot of order-book depth at a few percent bands around the mid price, and a three-day trend in on-chain transfer volume. These steps help you see whether activity is concentrated or broad.
quick, repeatable checks for spot and on-chain demand
use this as a starting checklist
In the quick check, look for coherence across the three items. If all three point higher, the signal is stronger. If only one item moves, treat the result as preliminary and plan a follow-up check over the next few days Glassnode guide to on-chain metrics.
Deeper checks for weekly monitoring
For weekly monitoring, widen the window to 7 to 30 days. Track active-address trends, staking inflows, and TVL where relevant, and compare exchange inflow and outflow reports. Persistence across these measures reduces the chance that a ranking is driven by short-lived events CoinMetrics state of the network.
Keep a simple log of these weekly checks so you can spot whether demand builds gradually or is concentrated in a short window.
Tools and sources to track coins market demand
On-chain analytics and exchange reports to consult
Sources include on-chain analytics for transfer and address metrics, exchange order-book and volume data, and asset-management flow reports for institutional movements. Each source covers part of the picture, so combining them helps validate signals before acting on perceived demand changes CoinMetrics state of the network. Also consult flow data such as The Block flows data for exchange and custody movement charts.
When you consult reports, check provider documentation so you understand definitions and time windows used to compute metrics.
Using dashboards and alerts without paying for premium data
Free dashboards and exchange interfaces can provide basic snapshots and alerts. Use built-in alerts for volume or price thresholds, and set simple on-chain monitoring where possible. Premium feeds offer more historical depth and refined liquidity measures, but many useful checks can be done with free tools and official exchange reports.
Verify any important claim by checking primary reports or provider notes to avoid misinterpretation of aggregated data.
How to evaluate coins: decision criteria and risk considerations
Decision factors to weigh before adding a coin to a watchlist
Key decision factors include liquidity, persistence of demand, developer activity or TVL for Layer 1 and Layer 2 projects, and evidence of institutional flows. These elements help you judge whether interest is broad or narrow and whether trading is practical given your size and time horizon CoinMetrics state of the network.
For smaller coins, thin liquidity and concentrated holdings raise the risk of price moves that do not reflect broad adoption, so weigh those factors carefully before allocating attention or capital.
How demand signals interact with risk and time horizon
If your horizon is short, liquidity and order-book depth become more important because you need to enter or exit quickly. For longer horizons, persistent on-chain adoption trends and developer activity gain importance. Align monitoring with your risk tolerance and the time you plan to hold any exposure.
Use conditional language and small, measured steps. Demand signals can inform watchlist priorities, not guarantee outcomes.
Common mistakes and data pitfalls when judging demand
Over-weighting price or single-day spikes
A common error is treating price-only signals or a single high-volume day as proof of lasting demand. Without follow-up checks for persistence and on-chain adoption, such conclusions are often premature. Cross-source verification reduces this risk Crypto Market Report 2024.
Always ask whether activity spreads across many addresses and whether order-book depth supports sustained trading at the observed prices.
Misreading exchange inflows without on-chain context
Large exchange inflows can indicate buying pressure, but if those inflows are not matched by rising active addresses or transfer volume, they might reflect custodial consolidation or rebalancing rather than user adoption. Check both exchange flow reports and on-chain metrics before updating a ranking Digital Asset Management Review H1 2025.
Simple cross-checks and a documented process help avoid these common mistakes.
Real-world scenarios: examples of demand patterns
Scenario A: news-driven listing spike vs user adoption
Imagine a mid-cap token that jumps in volume after a major exchange announces a listing. Spot volume spikes and price moves sharply for one day, but on-chain transfer volume and active addresses remain flat. The checklist would flag this as a probable short-term event rather than growing user adoption, so further monitoring over days is advisable Crypto Market Report 2024.
In this scenario, a cautious response is to add the coin to a watchlist and await persistent on-chain signs before treating the spike as a durable change in demand.
Scenario B: institutional ETF inflow changing rankings
Consider a large-cap coin that rises in demand rankings after a period of sustained ETF inflows. Exchange custody and fund flow reports show notable inflows while on-chain active addresses increase slowly. This pattern suggests institutional flows are the primary driver of the ranking change and may be transient around reporting windows Digital Asset Management Review H1 2025.
Here, retail researchers should monitor whether on-chain adoption follows institutional interest and treat the ranking change as provisional until corroborated by user-side metrics.
Sample watchlist templates and how to monitor them
A simple daily watchlist format
Use a compact daily template: 24-72 hour spot volume, an order-book snapshot for bid-ask spreads and depth, 7-day active-address change, and staking inflows if relevant. Keep entries short and consistent so you can compare across coins easily.
Record notes on whether spikes coincide with known events like listings or announcements to separate noise from possible adoption signals Glassnode guide to on-chain metrics.
Automating alerts and when to escalate checks
Set alerts for sharp volume increases, large exchange inflows, or sudden drops in order-book depth. When an alert triggers, run the quick checklist and, if signals align, perform deeper weekly checks. Escalate monitoring when institutional flow reports or on-chain metrics show persistent change.
Automate simple thresholds to save time, but avoid automated actions without human review when data gaps or off-chain flows are possible.
When demand signals matter for everyday investors
Use cases where demand checks are helpful
Demand checks help when you want to add a coin to a watchlist, confirm liquidity before a micro-trade, or validate whether a recent announcement corresponds with broader user activity. They are practical tools for timing monitoring and assessing execution risk. See related coverage in our crypto category.
For short-term decisions, focus on liquidity and order-book depth. For longer-term interest, prioritize persistent on-chain adoption and developer or TVL signals Digital Asset Management Review H1 2025.
When demand is less relevant than fundamentals or long-term plans
Demand signals are less useful when longer-term fundamentals, regulatory context, taxes or personal financial plans are the main drivers of a decision. If your goal is long-term saving or exposure tied to a time horizon, broader fundamentals and diversification tend to matter more than short-term demand metrics.
Use demand monitoring as one part of a wider decision process, not the sole basis for action.
Summary and next steps: how to use demand data prudently
Key takeaways
Demand in the coins market is best judged with a multi-metric approach that blends spot trading volume, order-book liquidity and on-chain activity. Persistent increases in active addresses and transfer volume are usually stronger signals of user-driven demand than price moves alone Glassnode guide to on-chain metrics.
Institutional flows and derivatives can change rankings and create data gaps, so treat any ranking as provisional when off-chain activity is plausible.
A short verification checklist before acting
Before responding to perceived demand changes, run a short verification: check 24-72 hour spot volume, a liquidity snapshot, 7-30 day active-address trends and exchange flow reports. If multiple signals align, confidence is higher; if they diverge, raise caution and monitor further CoinMetrics state of the network.
Keep records of checks and use them to refine your thresholds and rules of thumb over time.
A quick signal check in 24 to 72 hours can show whether a spike persists, but analysts usually compare multi-day on-chain trends and active-address changes over 7 to 30 days to judge sustained demand.
On-chain metrics like transfer volume and active addresses are often more reliable indicators of user activity than price alone, but they are best used alongside spot and liquidity data because each metric shows a part of the picture.
No. Institutional flows can move demand rankings temporarily, so compare custody and exchange flow reports with on-chain adoption signals before changing exposure.
References
- https://insights.glassnode.com/guide-to-on-chain-metrics
- https://www.altrady.com/crypto-trading/onchain-blockchain-analytics-for-traders/how-to-read-interpret-onchain-metrics
- https://www.chainalysis.com/reports/crypto-market-report-2024
- https://messari.io/reports/on-chain-indicators-2024
- https://messari.io/research/state-of-market-structure-2025
- https://coinmetrics.io/state-of-the-network-2024
- https://www.chainalysis.com/reports/crypto-market-report-2024
- https://www.cryptocompare.com/asset-management-reports/h1-2025
- https://financepolice.com/advertise/
- https://www.nansen.ai/post/key-onchain-metrics-signal-market-changes-drive-data-driven-decisions
- https://www.theblock.co/data/on-chain-metrics/flows
- https://financepolice.com/crypto-influencers-and-their-role-in-stimulating-retail-interest/
- https://financepolice.com/bitcoin-price-analysis-btc-reclaims-92000-as-market-awaits-fed-decision/
- https://financepolice.com/category/crypto/
0
0

 Manage all your crypto, NFT and DeFi from one place
Securely connect the portfolio you’re using to start.

0
0


0
0
