BNB Price Analysis of March 12, 2025: BNB Surges from $507 to $566, Will the Bullish Momentum Continue?

0
0

The BNB price trend has shown some bullish momentum after a V-shape recovery. If you are tracking BNB and wondering whether this momentum can be sustained, then you are at the right place. As we go through the BNB price analysis, we will explore different patterns and how BNB has reacted to them. We will also determine the recent support and resistance levels for the BNB price today and analyze whether it can break these critical levels. Without any further delay, let’s dive into the BNB price analysis and determine what the BNB price trend might be in the coming sessions.
BNB Price Analysis of the Last 24 Hours
After marking the low of the day at 00:50 UTC at $507, the price spiked to the upside, creating a support zone at $510. This spike was followed by a converging triangle, which broke out to the upside at 07:05 UTC, corroborated by a golden cross in MACD. The price then formed a spike and an expanding triangle pattern. In the meantime, RSI moved above the level of 70, indicating a pullback.
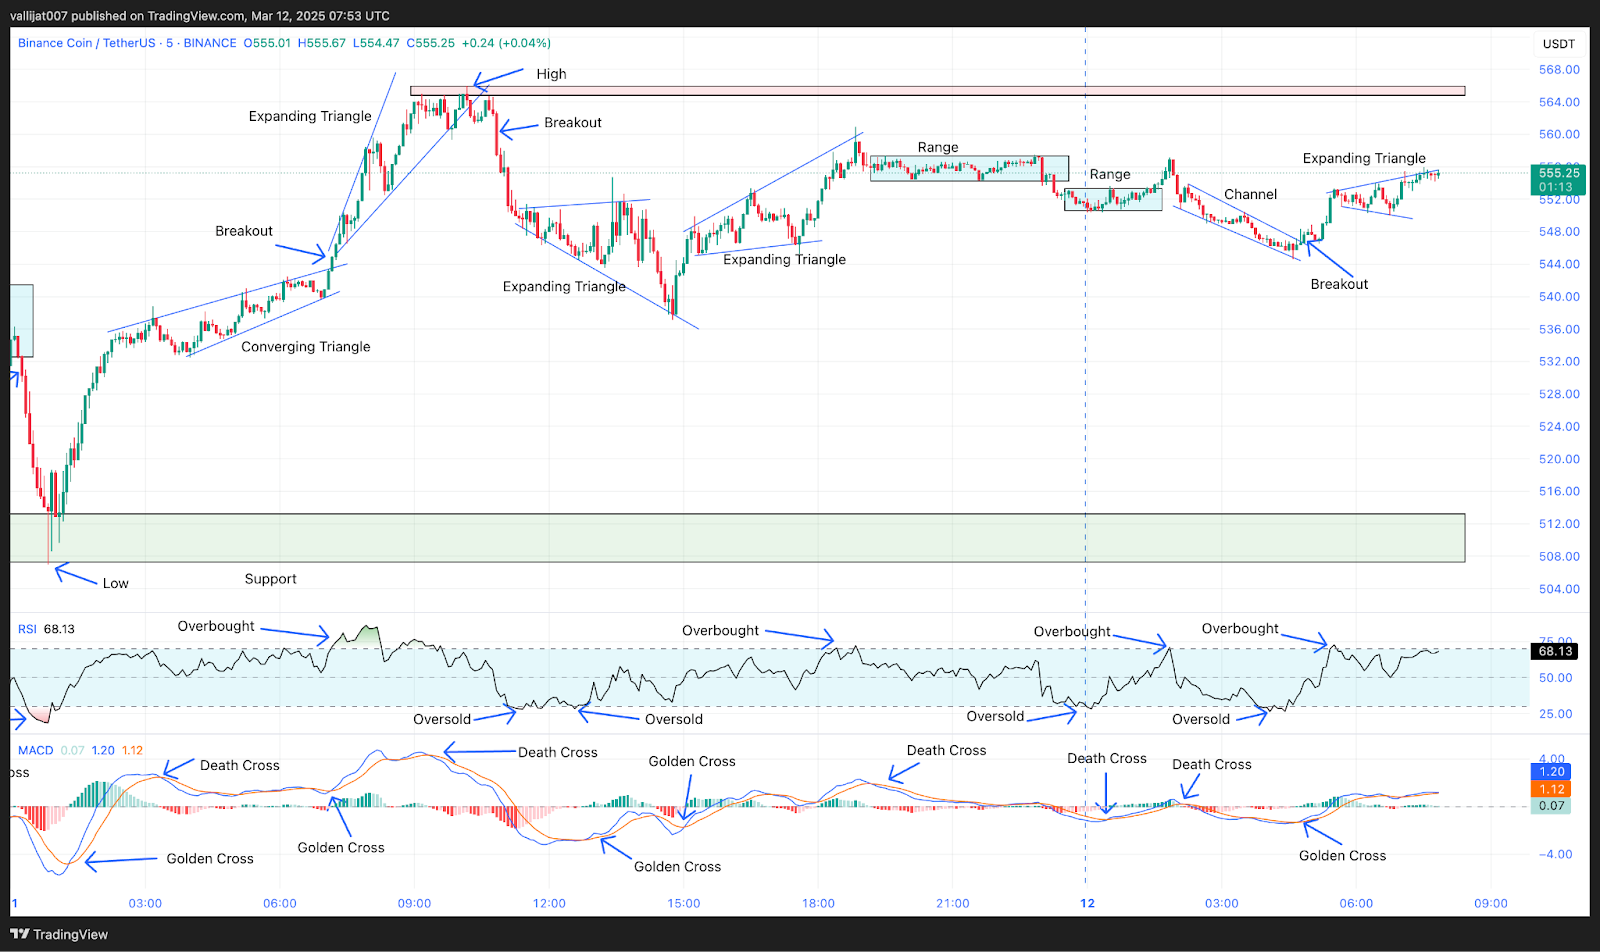
Chart 1: Analysed by vallijat007, published on TradingView, March 12, 2025
The expanding triangle marked the high of the day at 10:10 UTC at $563.50. The converging triangle broke out to the downside at 10:50 UTC, forming a spike and an expanding triangle pattern. Between 11:22 UTC and 12:40 UTC, RSI dropped below the level of 30, indicating a reversal or at least a pullback in the price.
BNB Faces Resistance at $565 After Recent Breakout
At 13:00 UTC, MACD showed a golden crossover, suggesting a pullback. The price spiked to the upside and formed another expanding triangle pattern. At 18:30 UTC, RSI moved into the overbought area, which was further supported by a death cross in MACD at 19:20 UTC, both supporting the formation of a range in the price.
The range broke out to the downside at 23:15 UTC, corroborated by a death cross in MACD. The price spiked and formed another range. This minor range attempted to break out to the upside at 01:30 UTC on March 12, but the breakout failed, and the price spiked to the downside, followed by a downward-moving channel.
At 04:05 UTC, RSI dropped below the level of 30, indicating an oversold market condition. The price broke out to the upside from the downward-moving channel at 04:50 UTC, supported by a golden cross in MACD. The price then spiked to the upside, forming another expanding triangle pattern in an attempt to test the resistance level of $565.
BNB Price Outlook: Breakout or Further Decline?
The BNB price today is holding its price well after a strong V-shape recovery, but BNB’s price is still in a downtrend in the higher timeframe. The consolidation shown by BNB is a hallmark of a potential breakout. If BNB breaks out and surpasses its resistance level, higher prices could be seen. It may, however, shortly approach or perhaps surpass its most recent low if it spikes to the downside. Given the extreme volatility and potential danger of the cryptocurrency market, traders and investors are advised to do their own independent analysis of the BNB price chart.
The post BNB Price Analysis of March 12, 2025: BNB Surges from $507 to $566, Will the Bullish Momentum Continue? appeared first on Coinfomania.
0
0

 Manage all your crypto, NFT and DeFi from one place
Securely connect the portfolio you’re using to start.

10
0