Dogecoin Price Prediction: This Chart Signals BIG Recovery

0
0

Current DOGE USD Price Overview
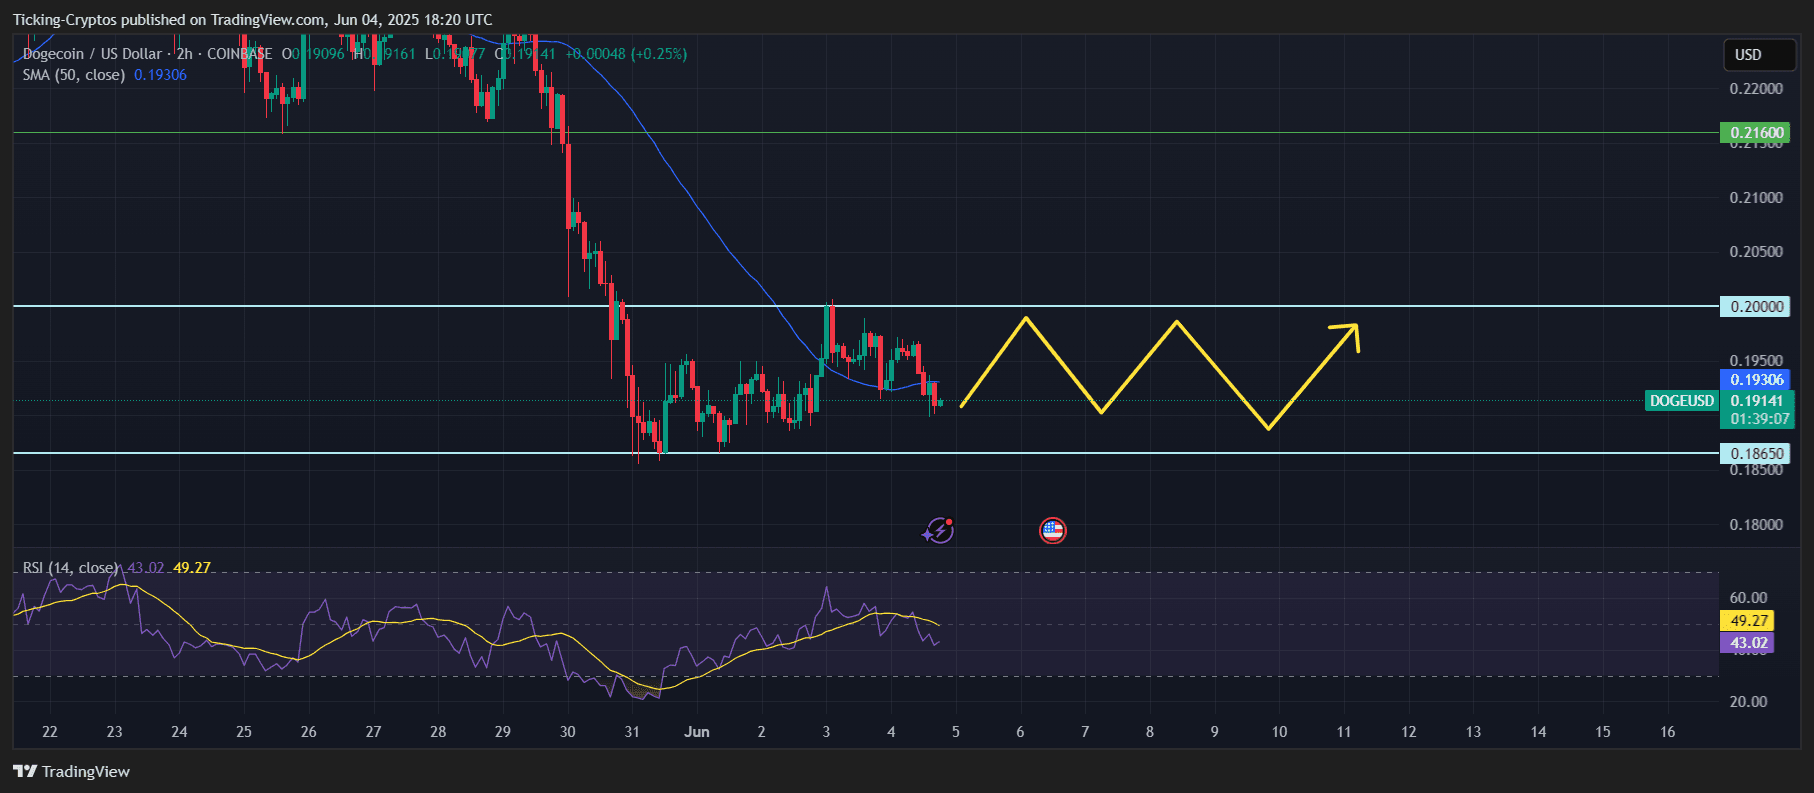
As of June 4, 2025, Dogecoin (DOGE) is trading at $0.19210 against the US Dollar, showing a modest decline of 0.43% in the current session. The popular meme cryptocurrency has been navigating a critical price zone between $0.18650 and $0.21600, with the market displaying signs of consolidation after a significant downtrend from higher levels.

DOGE/USD 2-hours chart - TradingView
Technical Analysis: Key Observations
Price Action and Trend Structure
The 2-hour chart reveals several important technical developments:
- Descending Channel Breakdown: DOGE has broken below a descending channel that had been containing price action since early May. This breakdown initially appeared bearish but has since shown signs of stabilization.
- Support Zone Formation: The cryptocurrency has established a strong support zone around $0.18650-$0.19000, which has been tested multiple times and held firm. This level now serves as a critical floor for any bullish reversal attempt.
- Moving Average Dynamics: The 50-period Simple Moving Average (SMA) shown in blue is currently acting as dynamic resistance around the $0.21600 level. Price needs to reclaim this level for a sustained bullish reversal.
RSI Analysis
The Relative Strength Index (RSI) presents an interesting picture:
- Current RSI reading: 44.07
- The indicator has bounced from oversold levels below 30
- Currently hovering in neutral territory, suggesting balanced momentum
- The yellow signal line at 50.50 indicates a slight bullish divergence developing
Volume and Market Structure
Recent trading sessions show:
- Increased volume during the support tests, indicating strong buying interest at lower levels
- Consolidation pattern forming between $0.19000-$0.20000
- Reduced volatility compared to the sharp decline witnessed in late May
Dogecoin Price Prediction Scenarios
1. Bullish Scenario (40% Probability)
Target: $0.24000-$0.25000
For a bullish reversal to materialize, DOGE needs to:
- Break above the immediate resistance at $0.20000
- Reclaim the 50-period SMA at $0.21600
- Generate sustained buying volume
If these conditions are met, the next major resistance levels lie at:
- First target: $0.22000 (previous support turned resistance)
- Second target: $0.24000 (psychological level)
- Extended target: $0.25000 (measured move from current consolidation)

DOGE/USD 2-hours chart - TradingView
2. Neutral/Consolidation Scenario (45% Probability)
Range: $0.18650-$0.21000
The most likely scenario in the near term is continued consolidation:
- Price oscillates between established support and resistance
- RSI remains in the 40-60 range
- Volume remains moderate without significant spikes
- This consolidation could last 1-2 weeks before a directional move
DOGE/USD 2-hours chart - TradingView
3. Bearish Scenario (15% Probability)
Target: $0.17000-$0.18000
A breakdown below current support could lead to:
- Initial target at $0.18000 (psychological support)
- Extended target at $0.17000 (next major support level)
- RSI falling below 30 would confirm bearish momentum

DOGE/USD 2-hours chart - TradingView
Key Factors Influencing Dogecoin USD Price
Market Sentiment Indicators
- Cryptocurrency Market Correlation: DOGE continues to show strong correlation with Bitcoin and the broader crypto market
- Social Media Activity: Monitoring mentions and engagement remains crucial for meme coins
- Whale Activity: Large holder movements can significantly impact price
There is currently very little correlation between Elon Musk's mentions of his DOGE USD entity and Dogecoin. It seems as if the hype of Dogecoin faded from X, despite having a lot of famous X accounts named after DOGE.
Technical Indicators to Watch
- RSI Divergence: Any bullish divergence on higher timeframes could signal a trend reversal
- Volume Patterns: Increasing volume on upward moves would confirm buying interest
- Moving Average Convergence: Price reclaiming the 50-period SMA is crucial for bulls
Trading Recommendations over the Short Term
- Entry Points: Consider entries near $0.19000-$0.19200 support
- Stop Loss: Place stops below $0.18500 to limit downside risk
- Take Profit: Initial targets at $0.20500 and $0.21600
$DOGE $DOGECOIN
0
0


 Manage all your crypto, NFT and DeFi from one place
Securely connect the portfolio you’re using to start.


0
0
