Whales Accumulate BONK Despite Battered BONK Price Structure: Is BONK About to Blast?
0
0
In the volatile world of meme coins, a now-battered BONK still has a grip on the crypto community, with its Solana-based ecosystem and large community driving up hype. As of August 2025, BONK’s price continues to fluctuate and struggle against Ethereum’s dominance, yet, with accumulation underway, is BONK emerging as one of the strongest meme coins.
$BONK is the most accumulated token across all blockchains in the past week
more people accumulated $BONK than $AAVE, $PEPE, $PUMP, $PENGU, and #FARTCOIN in the past week
the dog is far from done
new ATHs and much higher are inevitable
GOD WILLING https://t.co/Nx5BwgrLFX
— Unipcs (aka 'Bonk Guy')
(@theunipcs) August 25, 2025
Over the past 7 days, BONK has been the most accumulated token across all blockchains, boasting a volume of $120M! This article dives into the current BONK Price prediction analysis and historical trend.
Whether you’re an experienced trader or new to crypto, uncover new insights that could help shape your next move. Before moving forward, please get acquainted with my previous BONK article.
DISCOVER: 20+ Next Crypto to Explode in 2025
BONK Price Analysis And Predictions For September 2025

(BONKUSD)
The first chart we will look at in this BONK Price prediction piece will be on the 1W timeframe. BONK price has been effectively range-bound on the high time frame between 0.0092 and 0.048 ever since pumping in 2023. That is a broad range, but it is good to remember we are looking at a meme-coin chart.
It also indicates that a breakout will be volatile, and if it is to the upside, it should increase the price at least 2-3x from the upper boundary on the HTF.
One more important indicator here is the Moving Averages, and currently, the price is bouncing off of MA100. RSI is not in the overbought area, which gives space for another push up. However, what really matters at the end is a break to the upside or the downside – that will be the decisive move.
DISCOVER: 9+ Best High-Risk, High-Reward Crypto to Buy in 2025
 (BONKUSD)
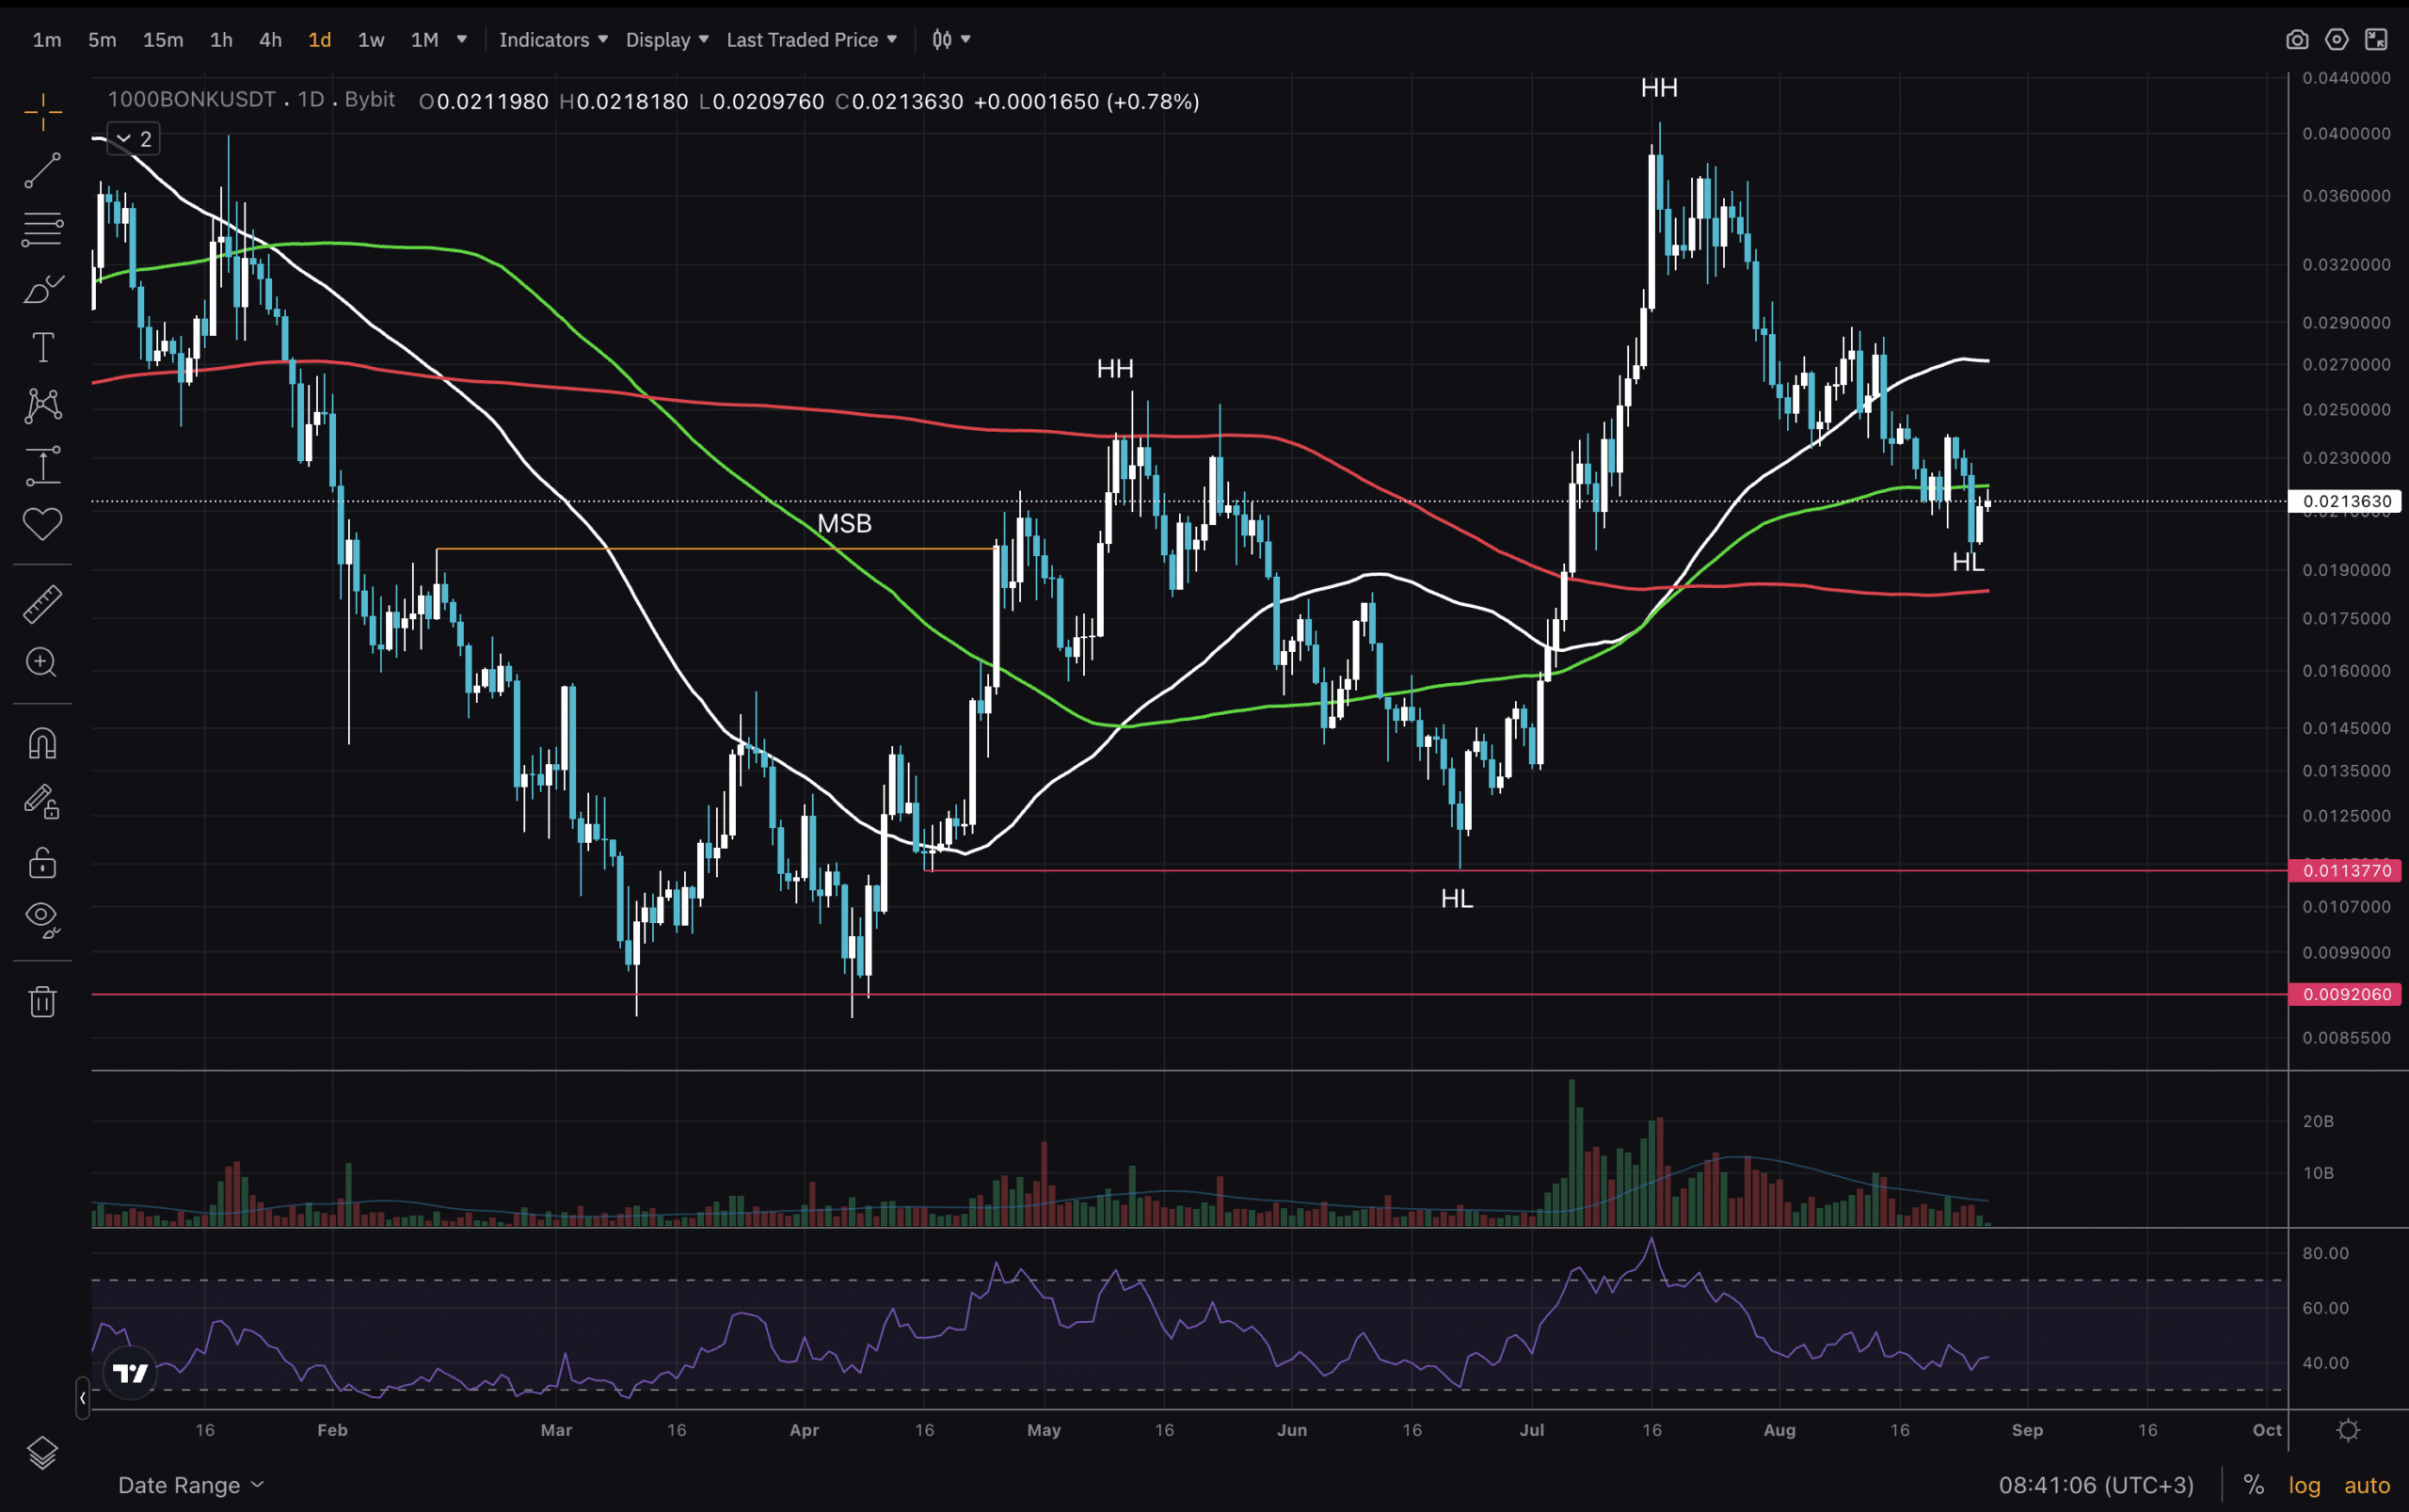
Zooming in, on the 1D timeframe, the new BONK market structure is quite visible, with potentially the second Higher Low being formed on the daily.
A great sign is the increase of volume when BONK price is moving up, and low volume when it goes down. This demonstrates that buyer interest is stronger.
Another key piece of the puzzle here is the recent reclaimation of MA200, and ideally, the price stays above it. And in a final bullish signal, the RSI indicator is now resting on the bottom side, leaving room to go up again.
DISCOVER: Best Meme Coin ICOs to Invest in 2025
BONK Price Break in September? Conclusions And Expected Next Move
(BONKUSD)
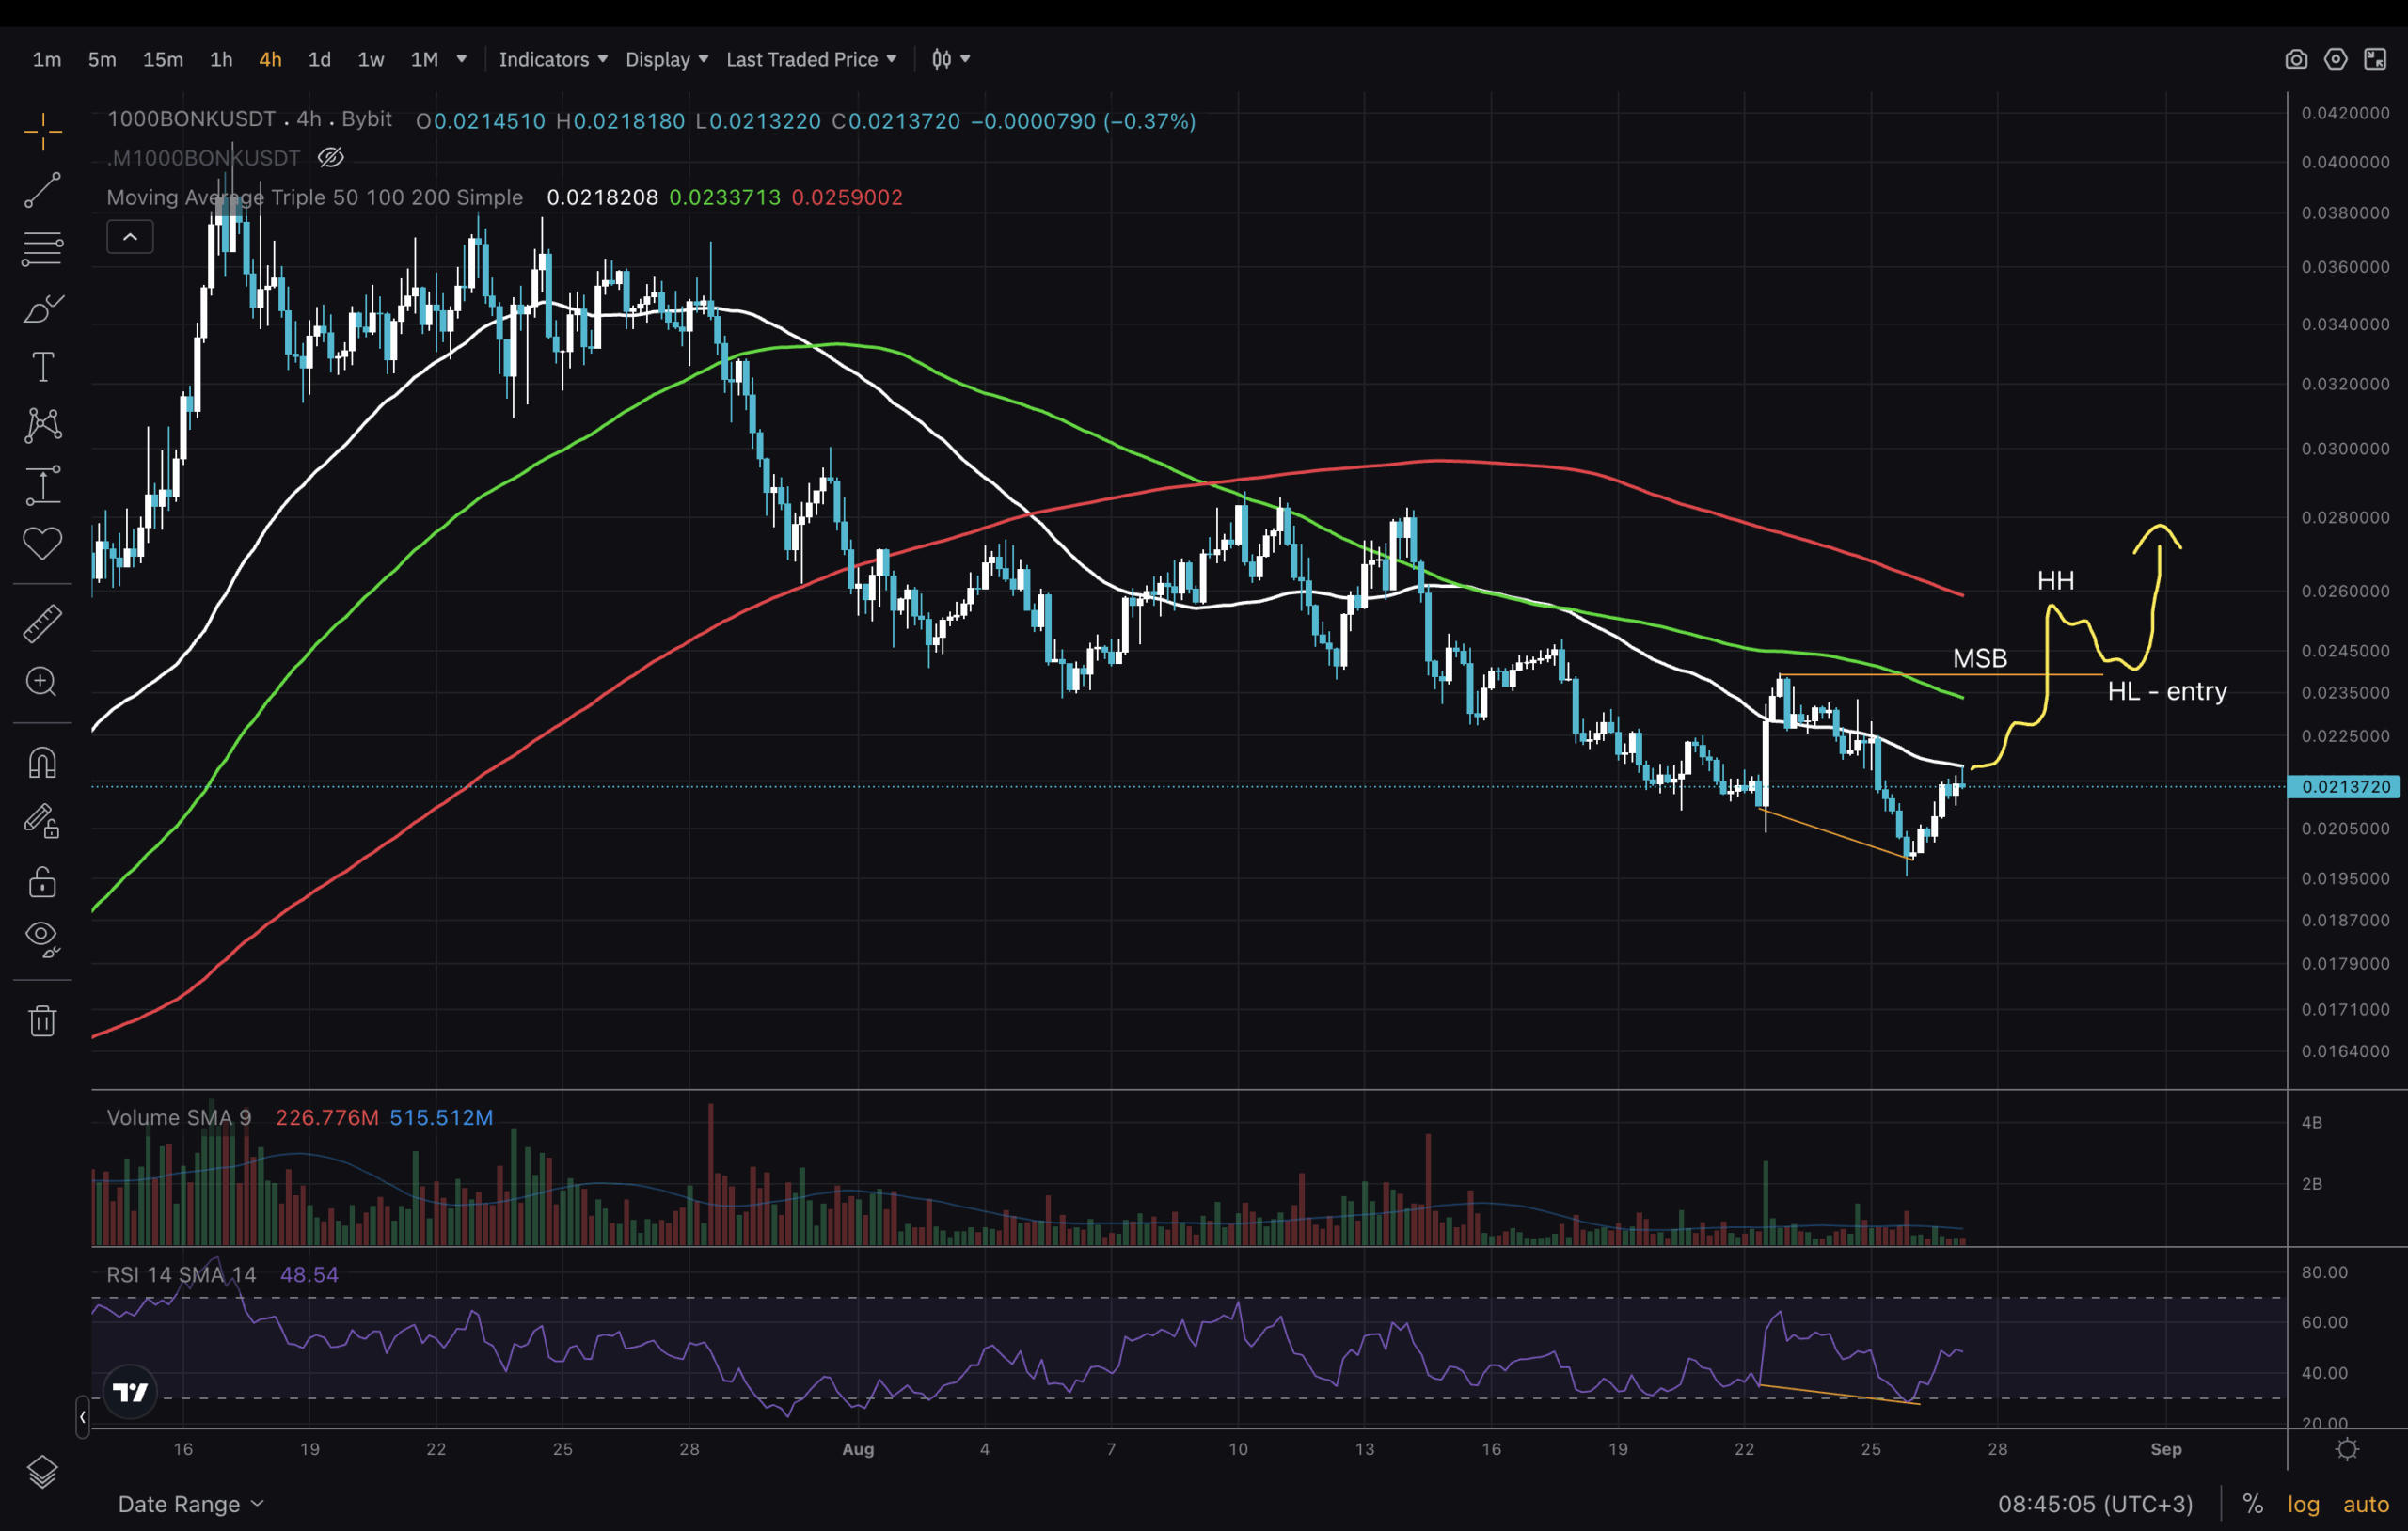
The last chart for today is on the 4H timeframe. Here, the BONK price is below all Moving Averages and retesting the underside of MA50. This is the timeframe to watch if one is looking for an entry.
I would want to see a Market Structure Break first, followed by a higher low, before I enter a long position. The RSI looks bottom here, which could align with such a move. A reclaim of the moving averages should send the price back up towards the $0.04 level.
DISCOVER: Top Solana Meme Coins to Buy in 2025
Join The 99Bitcoins News Discord Here For The Latest Market Update
BONK Price Prediction 2025: Is There A Future For This Memecoin?
- Price is still range-bound on the 1W timeframe
- Daily chart is making higher highs and higher lows
- 4H chart needs to reclaim the Moving Averages before long entries
- Needs to form second Higher Low on 1D timeframe
The post Whales Accumulate BONK Despite Battered BONK Price Structure: Is BONK About to Blast? appeared first on 99Bitcoins.
0
0

 Manage all your crypto, NFT and DeFi from one place
Securely connect the portfolio you’re using to start.


