Bitcoin support levels around $28k as historical data, models offer promising insight

0
0
Quick Take
Bitcoin’s current trading position at $28,900 is perceived as being in uncharted territory, but certain models and historical data can provide insights into potential support levels. This analysis sheds light on the key figures that might serve as the foundation for Bitcoin’s price in the near term.
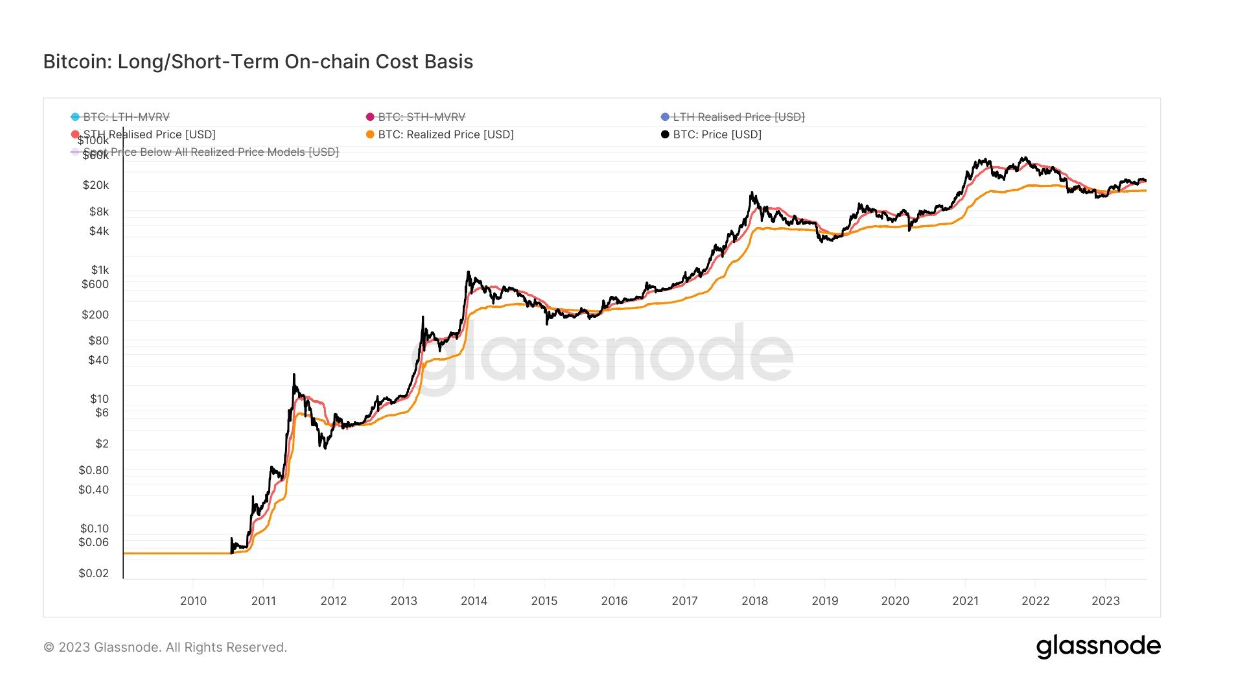
Short-Term Holder Cost Basis
The cost basis for short-term holders is currently at $28,300. This support level has already been tested twice this year, signifying a critical threshold. Moreover, it’s a level that has been frequently tested during bear markets, particularly in 2015 and 2019.
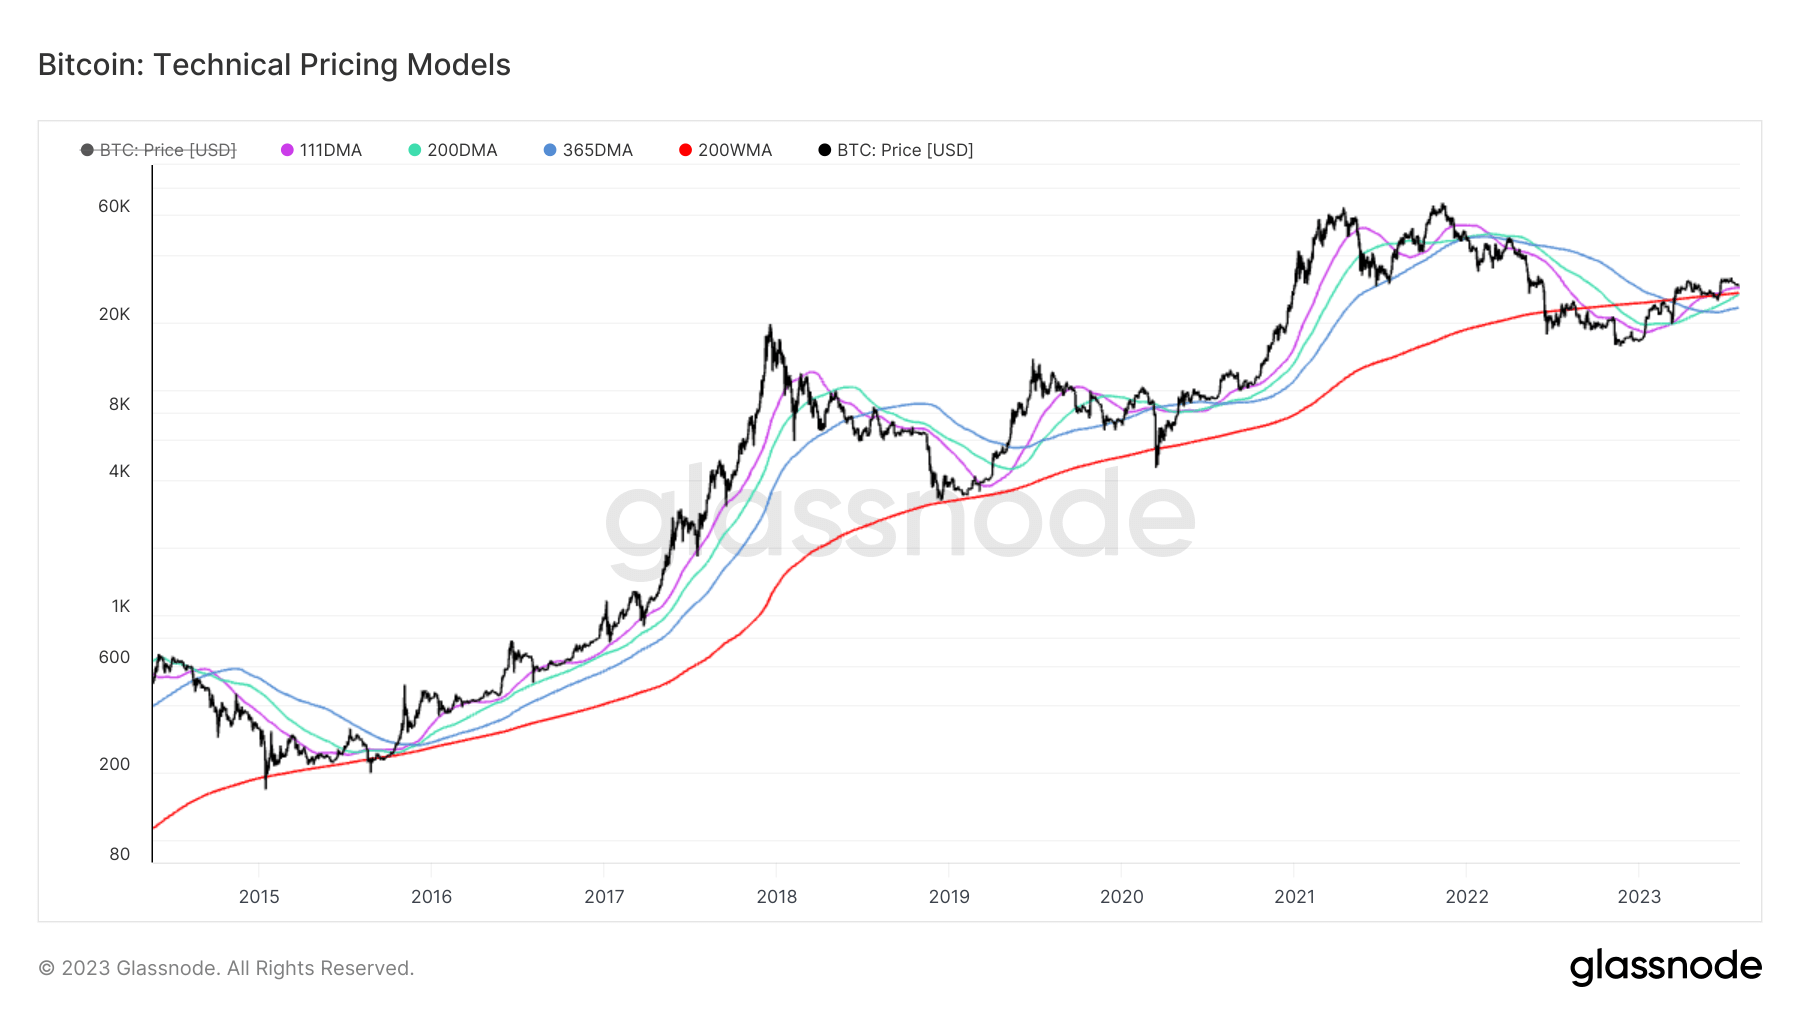
111-Day Simple Moving Average
Within the context of the Pi-Top Oscillator, the 111-Day Simple Moving Average, which is used to capture short to mid-term market momentum according to Glassnode, is trading at $28,500. This average provides another valuable perspective on where the support might lie.
Longer-Term Moving Averages
- 200-Week Moving Average: This long-term trend indicator currently trades around $27,101, offering a broader perspective on Bitcoin’s price support.
- 200-Day Moving Average: Slightly below the 200-week average, the 200-day moving average stands at $26,650, further delineating potential support levels.
The post Bitcoin support levels around $28k as historical data, models offer promising insight appeared first on CryptoSlate.
0
0

 Manage all your crypto, NFT and DeFi from one place
Securely connect the portfolio you’re using to start.


0
0
