
Solana Price Today Tops $106 as RSI Hits Overbought 80.51

0
0
As of August 28, 2026, Solana trades at $106.92, keeping the Solana price today comfortably above the psychological $100 level. The daily chart shows a strong uptrend alongside an overbought momentum warning that traders should monitor closely.
Key takeaways
- SOL trades at $106.92 on August 28, 2026, holding above the $100 level.
- The daily RSI14 sits at 80.51, deep in overbought territory.
- The daily MACD histogram remains positive at 2.59 and is still expanding.
- The crypto market cap is roughly $2.695 trillion, down 1.47% in 24 hours.
- PumpSwap fees rose 90.88% in 24 hours and 200.92% over seven days.
Daily Chart: Trend Extended but Momentum Stretched
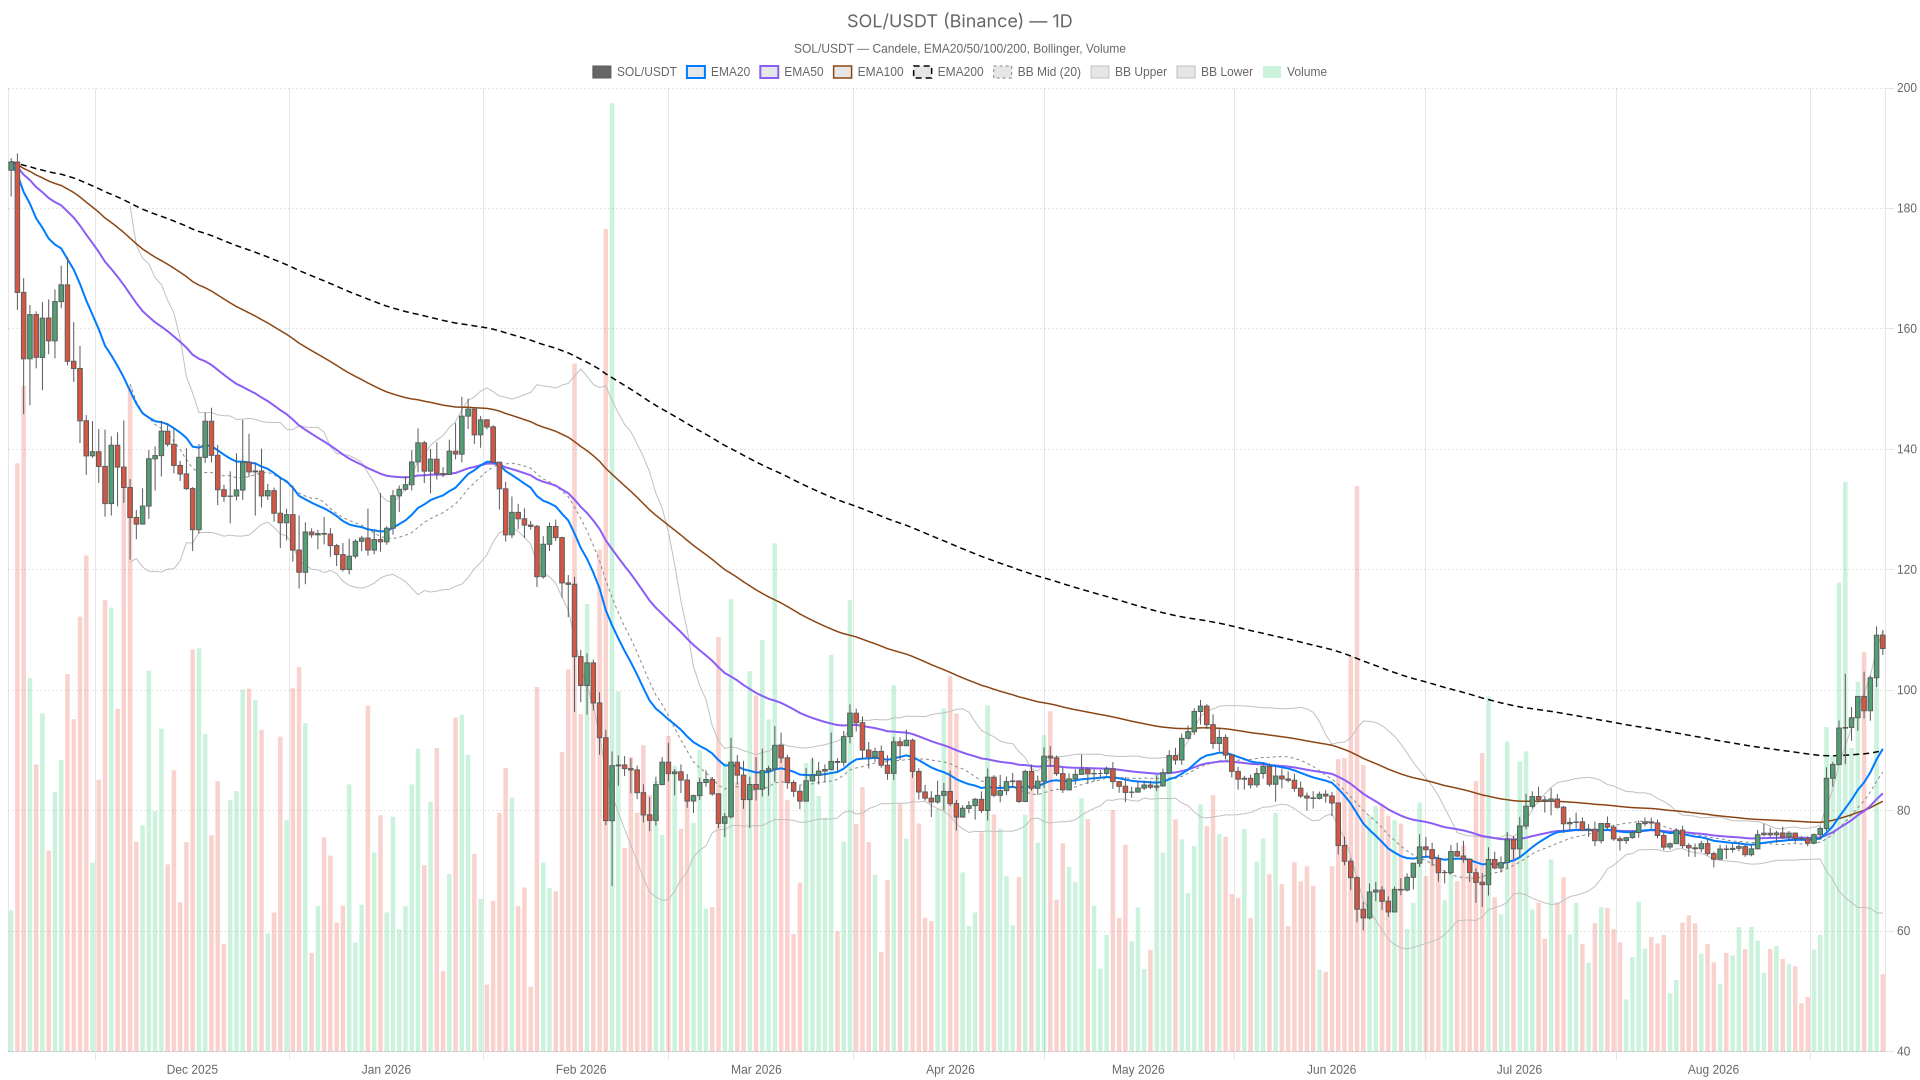
On the daily timeframe, the Solana price today at $106.92 remains well above every major moving average, yet momentum is stretched into overbought territory. Price trades above the EMA20 at 90.28, the EMA50 at 82.89, and the EMA200 at 89.93. That stacking, with the EMA20 above the EMA50, defines a healthy uptrend structure.
The catch is the RSI14 sitting at 80.51, deep in overbought territory. That is not a reason to panic on its own. However, it means the rally has outrun its own pace. Moves like this are more prone to sharp intraday pullbacks even if the broader trend stays intact.
The MACD backs up the bullish read for now. The line sits at 7.77 against a signal of 5.19, with a histogram of 2.59 that is still expanding. Momentum has not cracked yet. In fact, it is still accelerating on this timeframe.
The Bollinger Bands add useful context here. The mid-band is at 86.43, the upper band at 109.87, and price is hugging that upper boundary. When price rides the upper band this tightly, it usually signals a strong trending move rather than an imminent reversal. Still, it leaves little room before the band itself becomes resistance.
Volatility, measured by the ATR14 at 6.02, is elevated, which fits a market that just added a meaningful move in a short window. On the pivot structure, the daily pivot sits at 107.59, with resistance at 109.33 and support at 105.19. Price currently trades just below that pivot. Consequently, the immediate battle zone sits around the 105–108 range. Lose that zone and the overbought reading starts to matter more.
Hourly Chart: Momentum Cooling Inside the Uptrend
The hourly chart still reads bullish structurally, but short-term momentum is cooling. Price at 106.9 sits above the EMA20 at 106.79, the EMA50 at 103.93, and the EMA200 at 95.83. The regime tag confirms it as bullish.
Yet the RSI14 has cooled to 55.36, a neutral reading that shows none of the daily chart’s extremity. More telling is the MACD histogram, which has flipped negative at -0.5, with the line at 1.18 versus the signal at 1.67. That hints short-term momentum is fading even as the broader structure holds.
The Bollinger mid-band on this timeframe is 107.71, above current price. Moreover, the band’s lower boundary at 105.16 lines up closely with the daily S1 at 105.19. That overlap matters because support levels shared across timeframes tend to hold more weight when tested. The hourly pivot sits at 107.12, with S1 at 106.68. Price is wedged just under the pivot and hovering above nearby support. For now, this is a market catching its breath rather than reversing outright.
15-Minute Chart: Execution Context
Zooming in, the 15-minute chart shows a shallow, orderly pullback inside the larger uptrend. Price at 106.87 has slipped below both the EMA20 at 107.36 and the EMA50 at 107.44. The RSI14 has dropped to 42.58, a mild bearish tilt on the micro scale.
The MACD here is essentially flat, with the line at -0.2 and the signal at -0.28. That produces a tiny positive histogram of 0.08, which suggests the selling pressure is already losing steam. This is not a signal to build a macro view around. Instead, it simply confirms that the current pullback is shallow and orderly, playing out inside a much larger uptrend rather than against it.
Bullish and Bearish Scenarios for SOL
Two scenarios dominate the outlook for SOL, and both depend on the 105–107 support cluster.
The Bullish Case
The bullish case rests on the daily structure staying intact. As long as price holds above the EMA20 at 90.28 and, more immediately, above the 105–107 pivot cluster, the path of least resistance remains higher. Furthermore, the daily MACD histogram is still expanding, which supports that view.
A renewed push toward the upper Bollinger Band near 109.87 and the R1 pivot at 109.33 would keep this rally alive. However, a daily close back below the EMA20 near 90.28, or a decisive loss of the 105.19 support, would signal that the overbought unwind has real teeth rather than being a shallow dip.
The Bearish Case
The bearish, mean-reversion case leans on two early warning signs. The daily RSI sits at 80.51, and the hourly MACD histogram is fading at -0.5. Both suggest buyers are getting tired at these levels. Consequently, a slide back toward the daily EMA20 at 90.28, or even the Bollinger mid-band at 86.43, would not be shocking given how extended this move already is.
On the other hand, a strong reclaim of the hourly EMA20 at 106.79 would suggest dip buyers are already stepping back in. If the 15-minute chart also flips back above its own EMA20/EMA50 cluster at 107.36–107.44, the pullback would be over before it really started.
Market Backdrop and On-Chain Signals
The broader market context still favors risk appetite, while on-chain activity supports Solana’s relative strength. The crypto market cap sits at roughly $2.695 trillion, down 1.47% over 24 hours, with Bitcoin dominance at 59.2%. The Fear & Greed Index reads 73, classified as Greed. That backdrop shows clear risk appetite but also carries complacency risk.
A Fortune report published August 27 noted that while Bitcoin is having a great month, Solana is doing even better. SOL has soared back above $100, and the price action confirms it. That relative outperformance tends to draw fresh capital into an asset. However, it also means SOL has moved a long way, fast. That setup often produces sharp mean-reversion moves when momentum finally runs out of gas.
On-chain data supports the outperformance story. DEX fee data across Solana-based platforms shows real strength. PumpSwap fees jumped 90.88% in 24 hours and 200.92% over seven days. Orca DEX rose 22.46% daily and 57.2% weekly. Raydium AMM posted an 8.18% daily gain despite a rougher 7-day stretch.
That fee growth reflects genuine transactional demand on the Solana network, not just speculative price chasing. Moreover, it adds a fundamental piece to why SOL has outpaced Bitcoin this month.
Positioning and Risk Going Forward
The current setup is two-sided, and the next move depends on whether the 105–107 support cluster holds or breaks. Solana has rewarded trend-followers, but it now flashes an overbought signal that demands respect rather than dismissal. The daily trend is intact, the hourly chart shows early fatigue, and the 15-minute chart digests that fatigue in real time. None of this points to a clean, one-directional outcome.
Volatility is elevated, as the ATR readings across all three timeframes show. Consequently, position sizing and stop placement matter more than usual right now. Greed-driven markets can extend further than logic suggests, but they can also unwind just as fast once momentum cracks. Treat the current setup as a live, two-sided situation rather than a foregone conclusion, and let price action at the key levels do the talking.
FAQ
What is SOL trading at right now?
SOL trades at $106.92 as of August 28, 2026. That keeps it comfortably above the psychological $100 level, though the daily RSI14 sits deep in overbought territory at 80.51.
Is Solana overbought on the daily chart?
Yes. The daily RSI14 is at 80.51, deep into overbought territory. However, the MACD histogram is still positive at 2.59 and expanding, so momentum has not cracked yet.
Which support levels matter most for SOL?
The 105–107 cluster is the immediate zone, combining the daily S1 at 105.19 and the hourly S1 at 106.68. Below that, the daily EMA20 at 90.28 is the key structural level.
Why has Solana outperformed Bitcoin recently?
On-chain demand is a major factor. PumpSwap fees rose 90.88% in 24 hours and 200.92% over seven days. Orca DEX and Raydium AMM also posted gains, and a Fortune report noted Solana is doing even better than Bitcoin this month.
Disclaimer: This article is for informational purposes only and does not constitute financial advice, an investment recommendation, or a solicitation to buy or sell any financial instrument or cryptocurrency. The analysis provided is not indicative of future results. Investing in crypto assets and financial markets carries a high risk of capital loss. Always do your own research (DYOR) and consult a qualified financial advisor before making any decision.
Article produced with the assistance of artificial intelligence and reviewed by the editorial team.
0
0


 Manage all your crypto, NFT and DeFi from one place
Securely connect the portfolio you’re using to start.


