Ethereum (ETH) is Rising; But On-Chain Indicators Say $5,000 Can Wait

0
0

While the Ethereum price trades near $2,540, up 3.57% week-on-week, the conversation around a return to $5,000 is gaining momentum.
But the on-chain and volume indicators aren’t exactly rolling out a red carpet. ETH price hit its all-time high of $4,891 back in November 2021. Now, nearly four years later, many signals suggest the next leg up may not be as close as bulls hope.
Developer Activity No Longer Supports the $5,000 Hype
The most immediate red flag? Development activity.
Since mid-May, Ethereum’s dev contributions, tracked by the number of code commits and updates via major repositories, have dropped from 71 to just over 25, per Sentiment data.
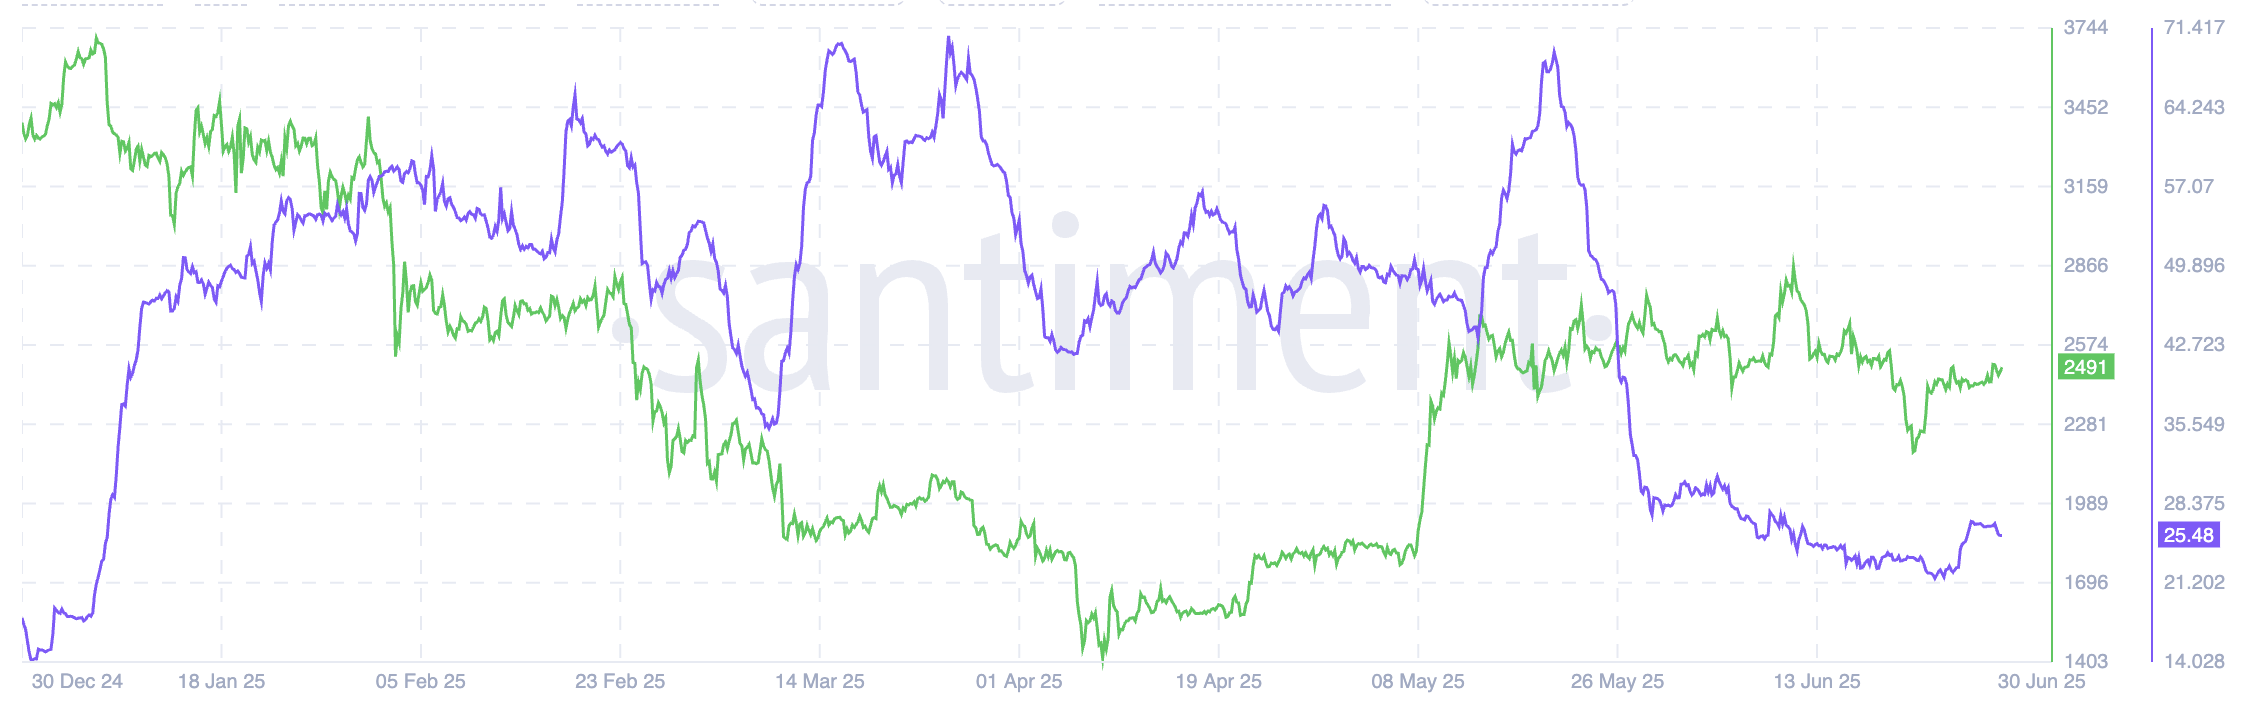 Development activity and ETH price: Santiment
That’s a near 65% decline in raw developer engagement, even as the price has continued pushing higher. This divergence often signals that core protocol innovation and on-chain growth are lagging behind the market hype. Notably, a similar spike in dev activity in December 2024 failed to ignite any price rally, adding more weight to the caution.
If Ethereum’s foundation layer isn’t evolving aggressively, it will limit long-term price justification and question the near-term $5,000 optimism.
HODL Waves Signal Erosion in Long-Term Confidence
HODL Waves, which group wallet holdings by holding duration, show another worrying trend. The share of ETH held in long-term addresses (those with a holding period of 6 months or more) has decreased, even during recent price rallies.
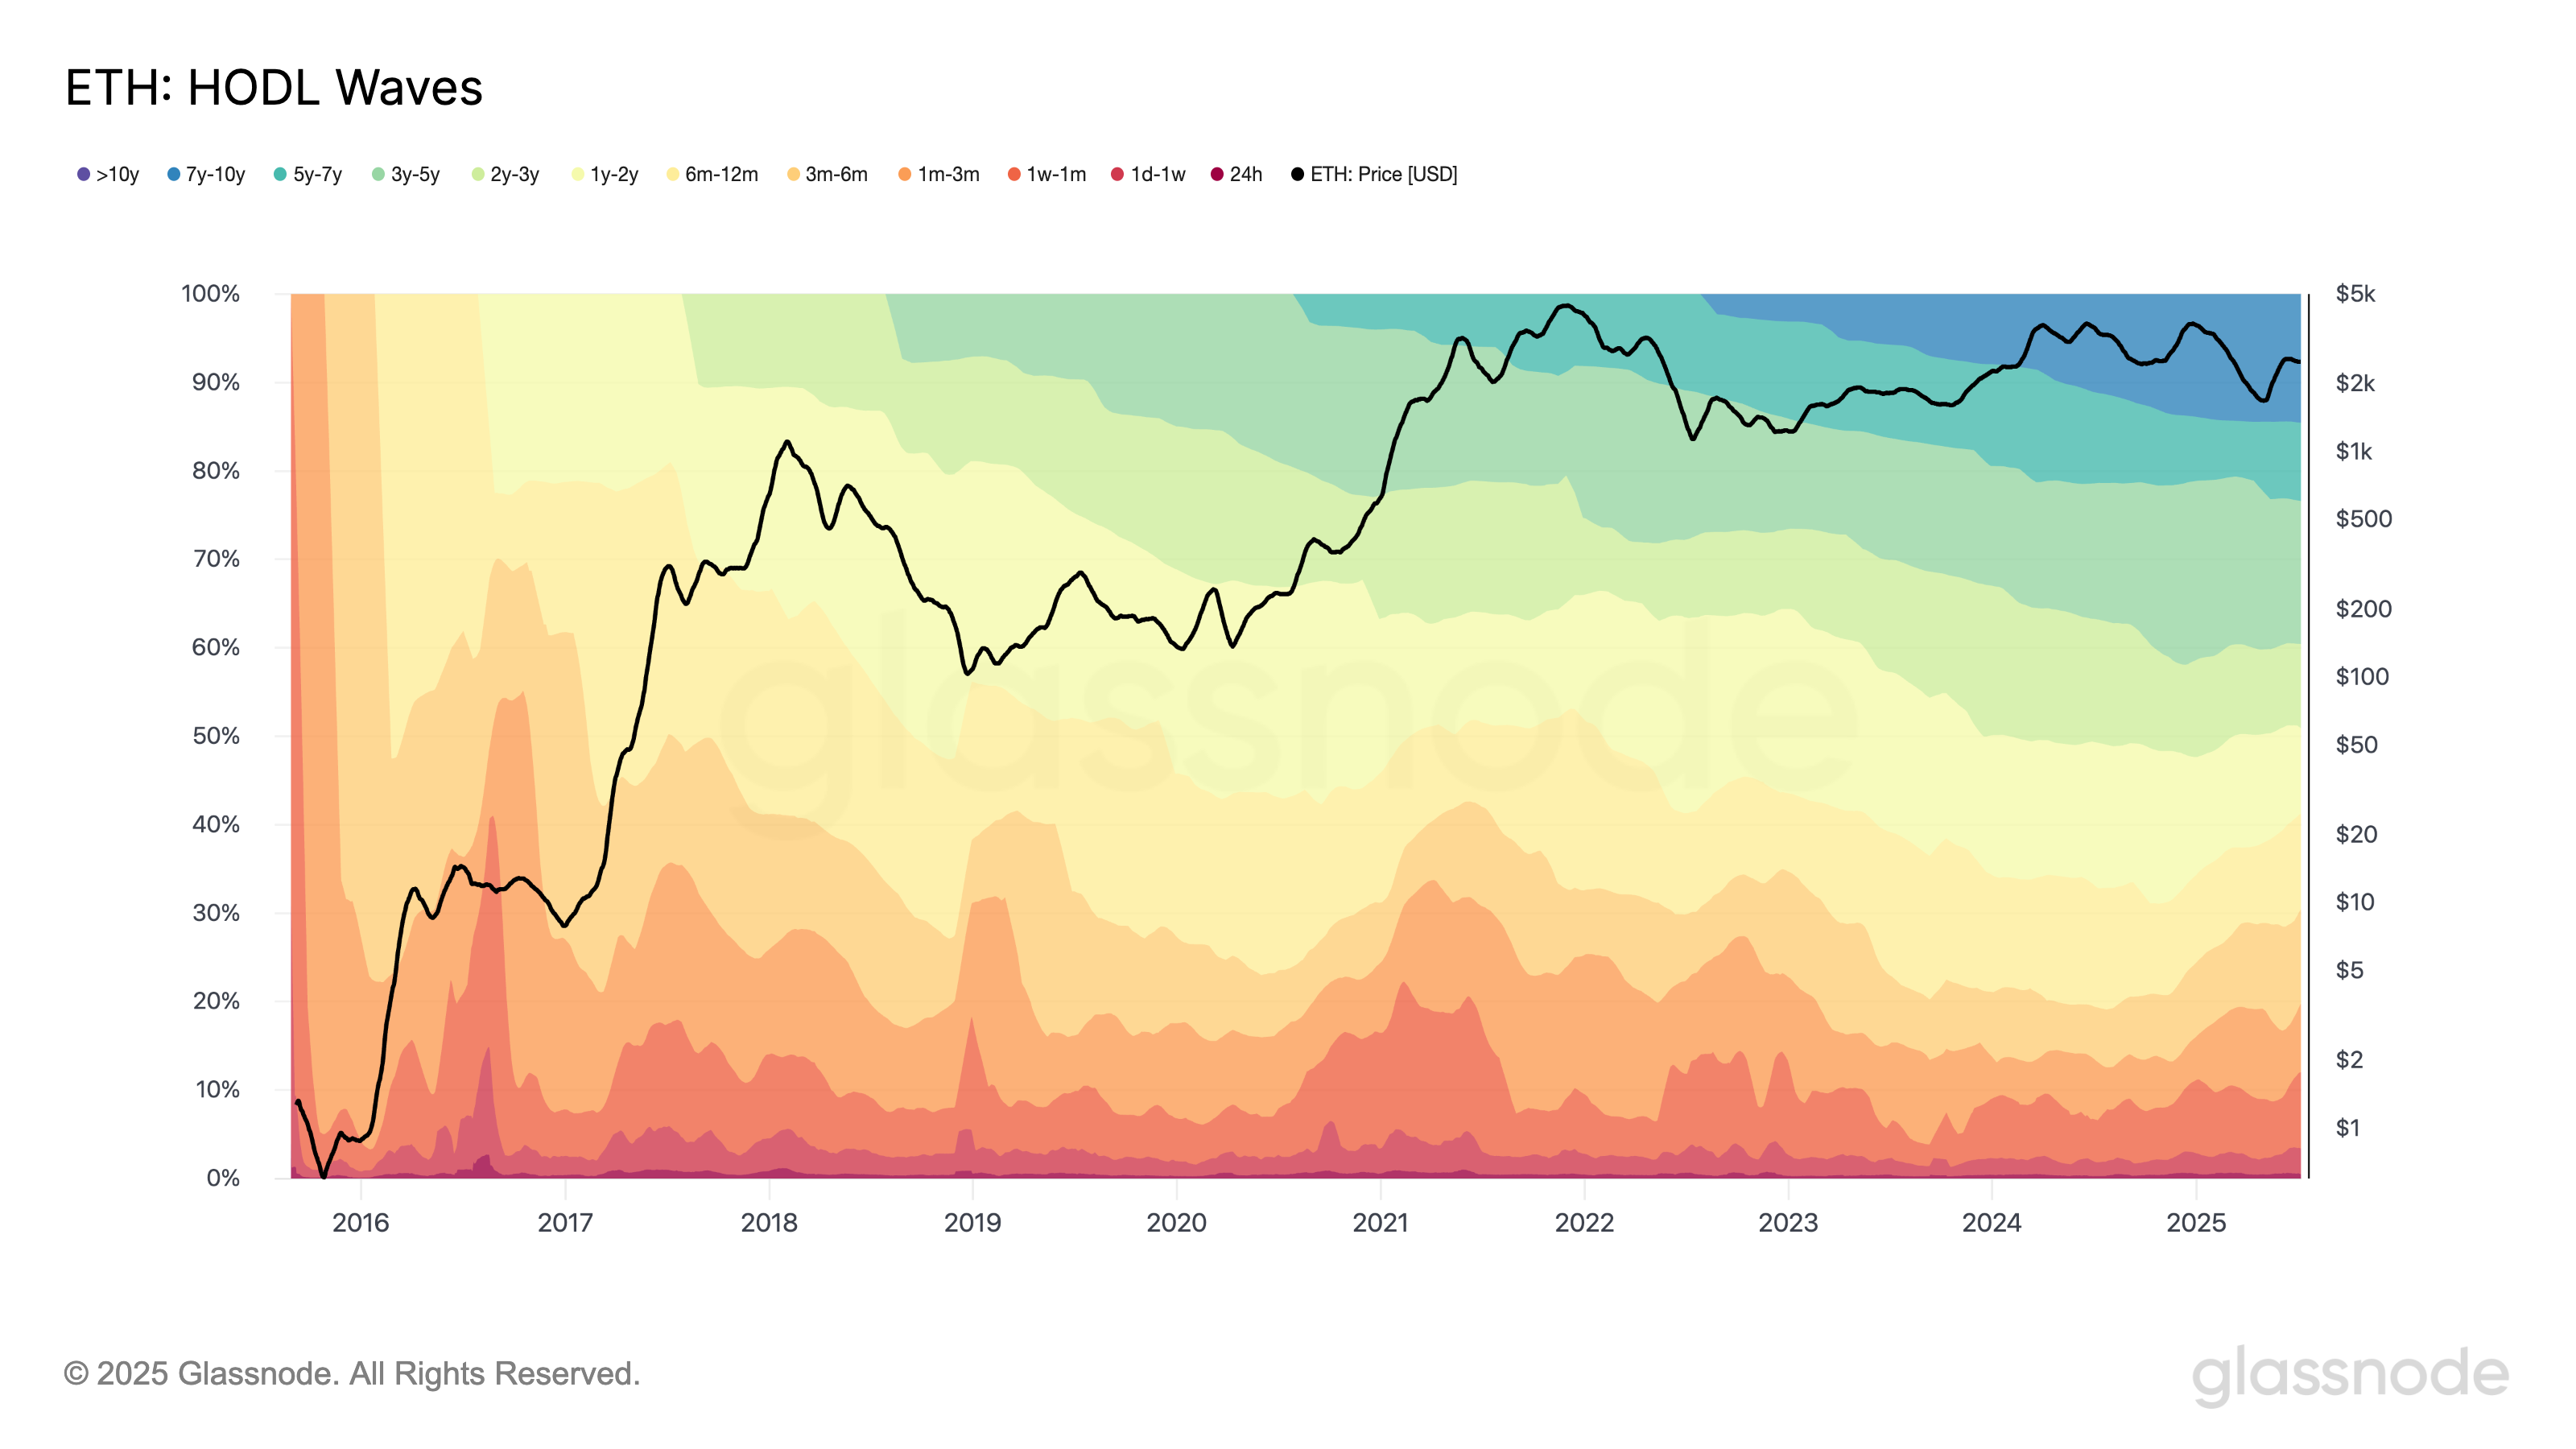 HODL Waves and ETH price: Glassnode
The dominant portion of ETH now sits in the 1-month to 6-month holding bands, suggesting more recent hands and potential swing traders. Compared to previous instances of price breakouts, where 1Y+ cohorts dominated the waves, this structure reflects softer conviction, a sign that many ETH holders may not stick around if the price faces a rejection of resistance.
CMF Confirms Smart Money Is Sitting Out
Chaikin Money Flow (CMF), a metric used to track volume-weighted accumulation, turned flat after a brief surge in April-May that coincided with Ethereum’s run from $1,300 to $2,700. Since then, it has struggled to push beyond 0.10, signaling a pause in meaningful buying pressure.
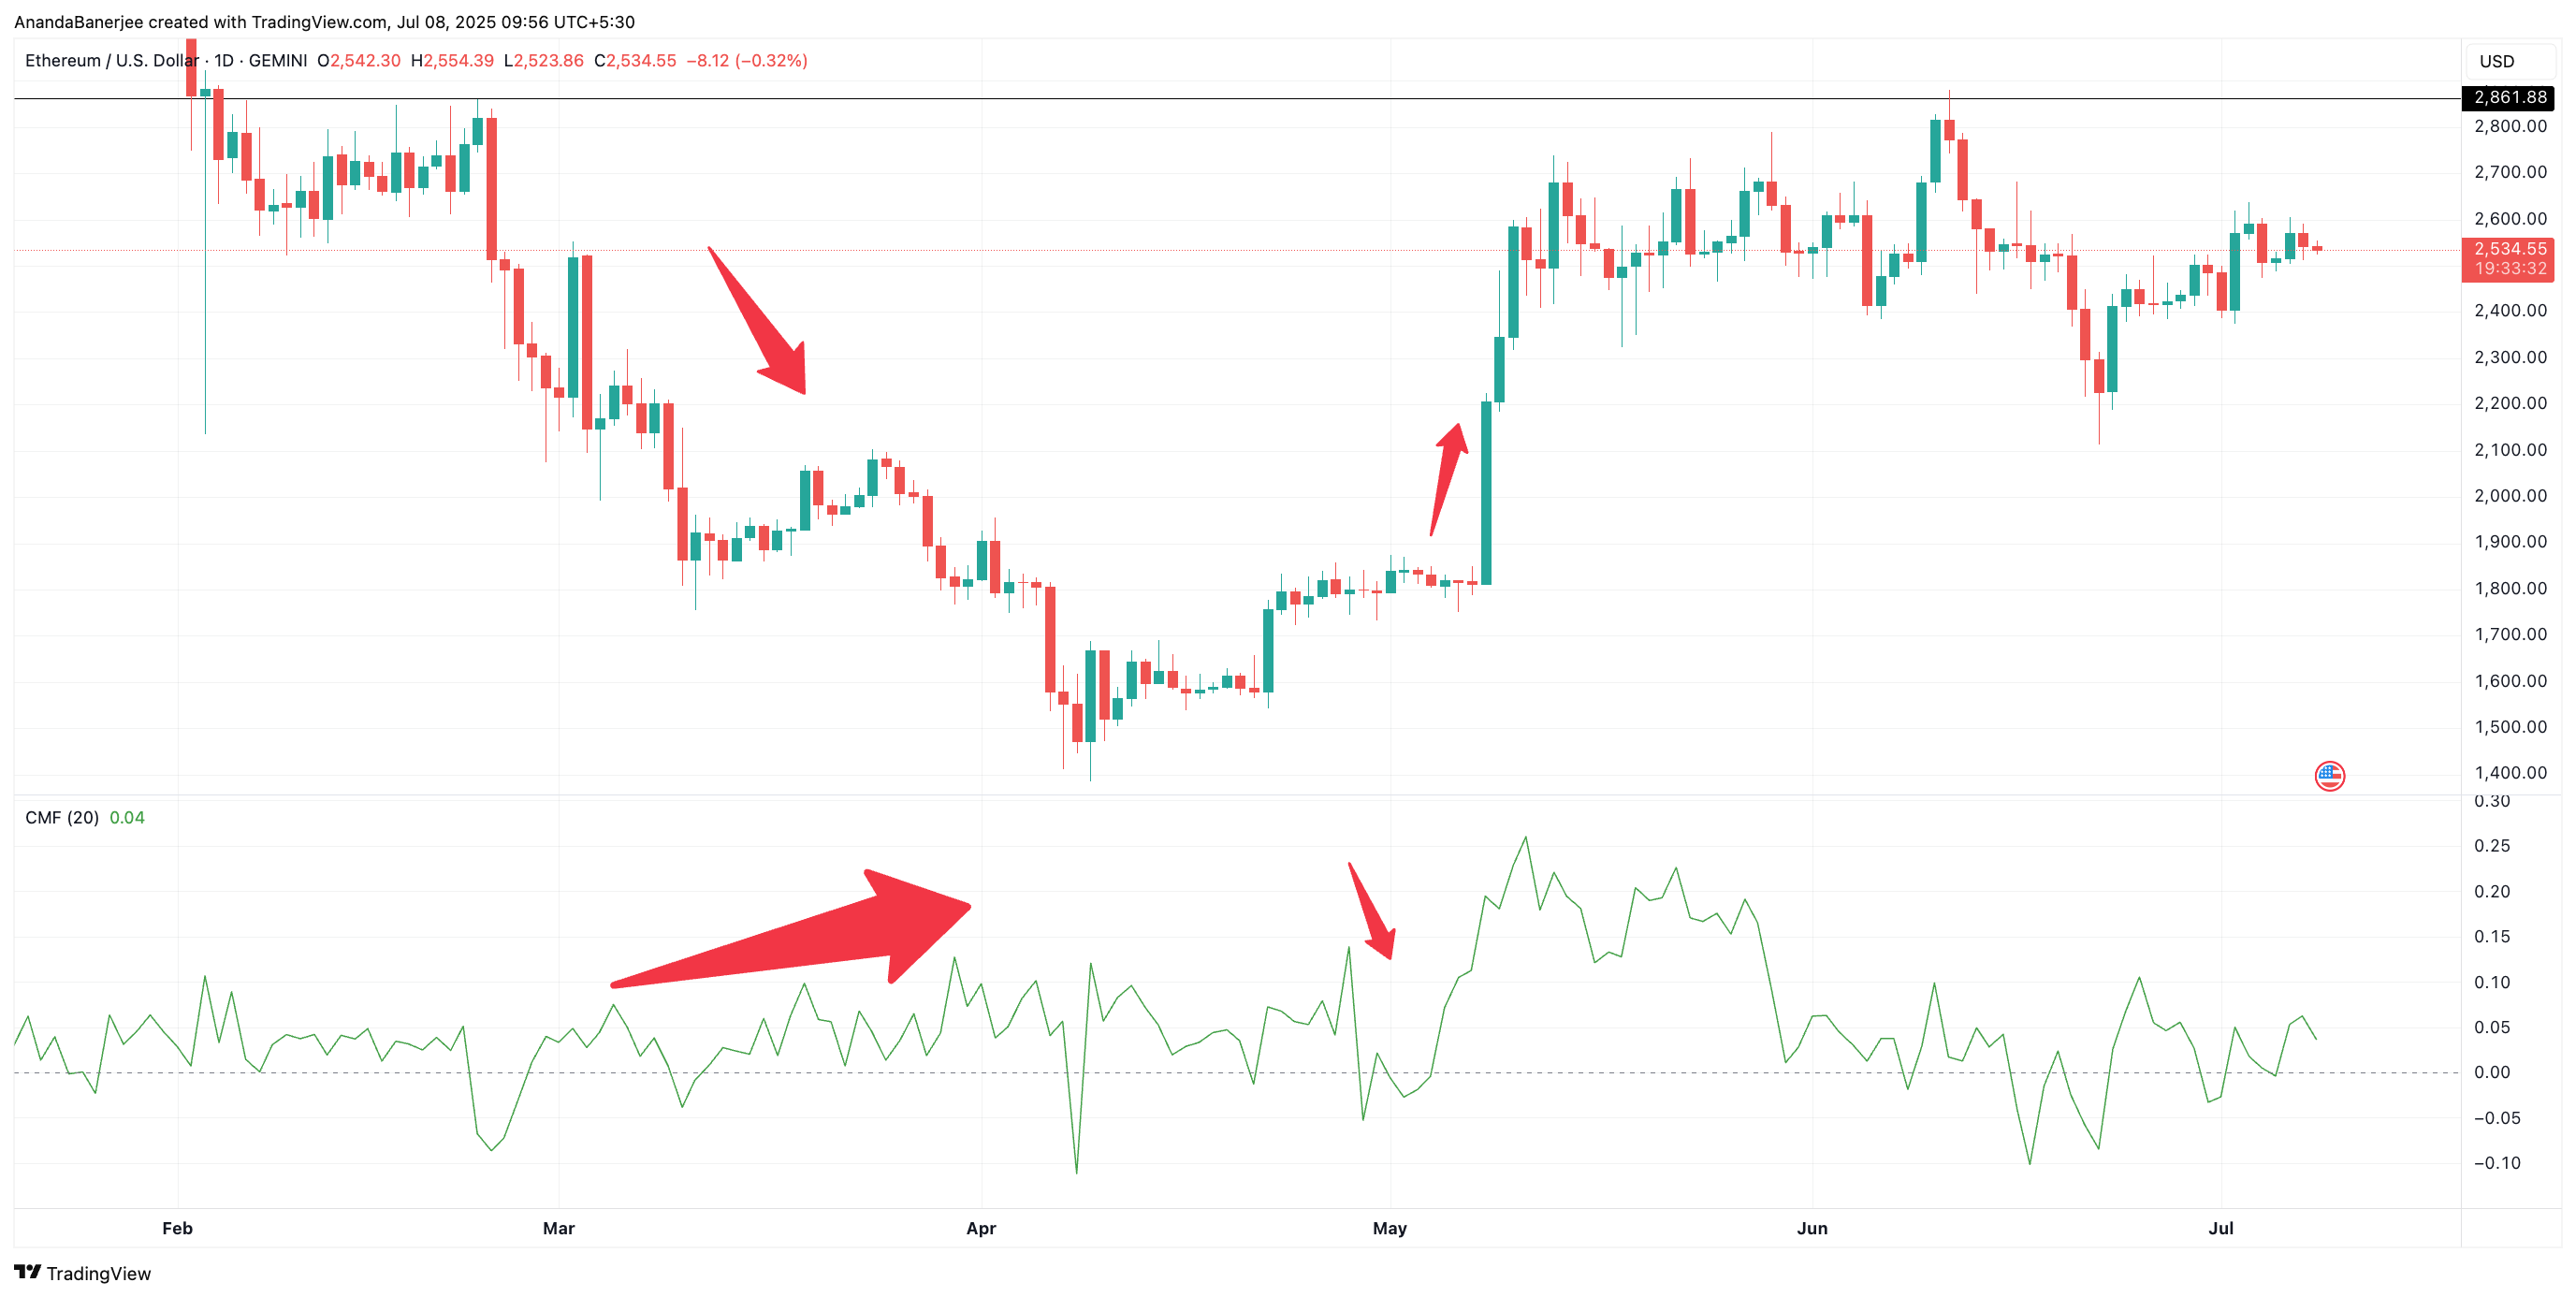 ETH price and CMF: TradingView
Price Structure Still Faces Tough Resistance
Ethereum is currently trapped below key resistance at $2,647. If momentum weakens further, support sits at $2,491 and $2,467. A breakdown below $2,467 could pull the price toward $2,376.
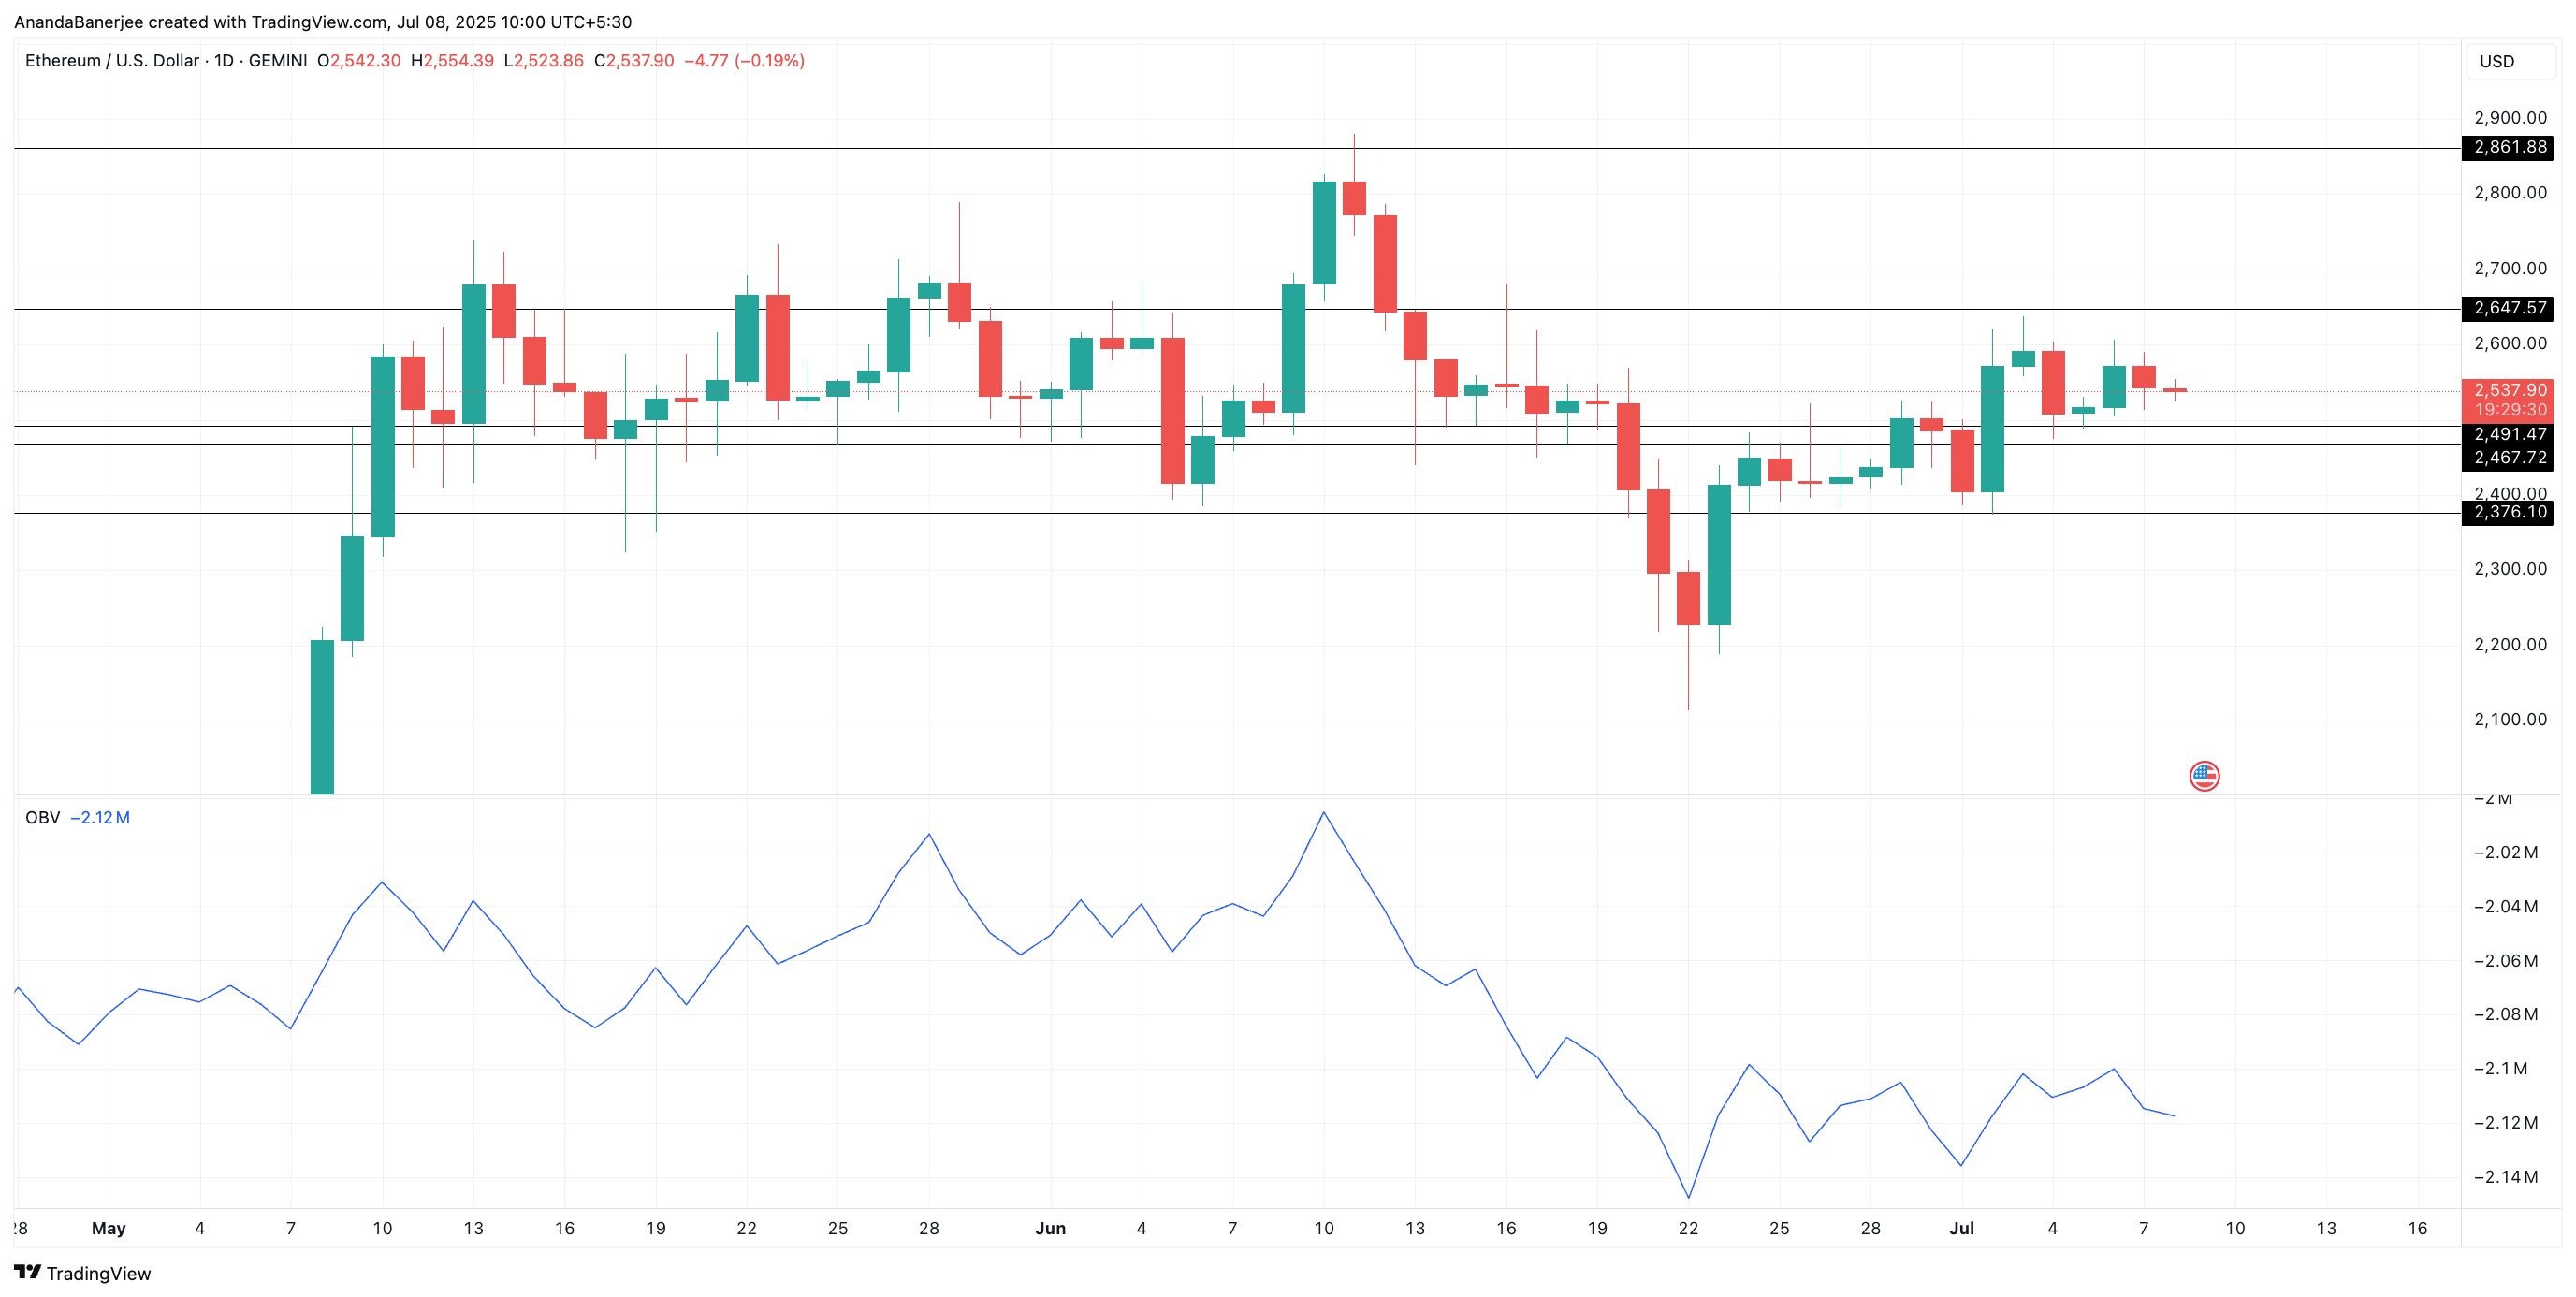 OBV and Key ETH Price Levels: TradingView
Meanwhile, On-Balance Volume (OBV), which adds or subtracts volume based on price direction, has been locked in a narrow band, just under -2.12 million. The lack of sizeable volume participation from whales (not one-off trades) and large wallets cast doubt on whether current levels, let alone $5,000, have the structural support to hold.
Without strong OBV or CMF readings to back a breakout, the $2,861 level will likely act as a firm rejection zone. That leaves $5,000 feeling like a psychological headline more than a viable next stop.
However, if Ethereum flips $2,647 into support, a level clearly visible on the current chart, it could invalidate the bearish outlook. And that would prime the ETH price for a move beyond $2,800. However, the bearish invalidation would imply renewed momentum, especially if paired with rising developer activity and a stronger CMF rebound.
0
0


 Manage all your crypto, NFT and DeFi from one place
Securely connect the portfolio you’re using to start.


