Solana Surges Toward $160 as Bullish Signals Point to Massive Breakout
0
0

Solana extended its recovery on June 16 as bullish momentum pushed the price to $156.84. This marks a 2.5 percent daily gain after buyers stepped in following a recent dip below $144 earlier in the week.
The surge gained strength after a key structure break was confirmed above $145. This zone acted as a demand area, sparking a shift in sentiment that has since led to a consistent upward move.
Traders are closely watching the price action between $158 and $160. This level represents a significant resistance zone, and a break above it could trigger an extended rally toward $167 and $176. Previous price data shows that these levels align with an old order block, adding to their relevance.
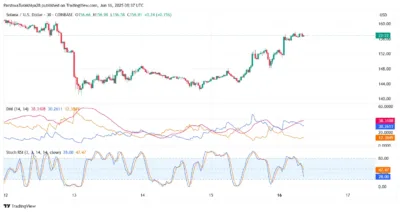
Momentum indicators on the 4-hour chart continue to support the bullish case. RSI stands at 64.26, just under the overbought level, signaling ongoing buying strength. MACD also shows a clear bullish crossover, and the Chaikin Money Flow index holds at 0.24, reflecting steady capital inflows.

Source:Tradingview
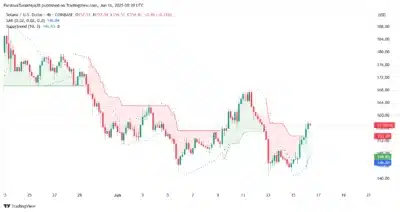
Trend-following tools further confirm the current upward bias. The Supertrend indicator remains green and sits below price at $146.85. Parabolic SAR dots continue to print below price candles, backing the prevailing bullish trend.
Also Read: Analyst Projects XRP Minimum Price for this Cycle, Says Holders are About to Get Rich
Solana Faces Crucial Breakout Test at the $158–$160 Resistance Zone
Additionally, volatility indicators are expanding as both Keltner Channels and Bollinger Bands have widened, with price trading near the upper bands. This often precedes an aggressive price move when supported by strong volume.
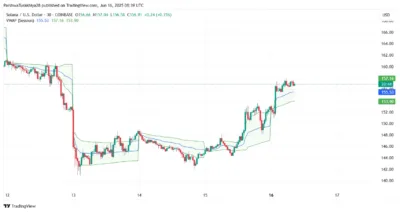
Volume Profile shows that the $152 to $155 range was reclaimed with strength. This value area previously acted as resistance but now appears to have flipped into support. VWAP on the 30-minute chart is positioned above $155, showing ongoing accumulation.

Source: Tradingview
Smart Money Concepts also show bullish intent. Multiple change-of-character patterns have occurred, followed by break-of-structure confirmations. These signals invalidate prior bearish setups, especially those formed near $140.

Source: Tradingview
Directional indicators further point to trend strength, with the +DI line overtaking the -DI line and ADX trending higher. Meanwhile, Bullish Bearish Power has flipped positive, and ATR readings suggest a wider price range may unfold.
Solana now faces its most critical technical test in the $158 to $160 zone. A clean breakout above this area could open the path to the $167 and $176 levels where sellers previously dominated. Failure to break through may lead to a pullback, with immediate support levels at $152.71 and $146.
All eyes are now on Solana as it approaches the $160 mark with rising volume and momentum. A confirmed breakout from this zone could trigger a strong continuation to the upside in the coming sessions.
Also Read: Important Day For XRP Community – Here’s What’s Coming
The post Solana Surges Toward $160 as Bullish Signals Point to Massive Breakout appeared first on 36Crypto.
0
0
 Manage all your crypto, NFT and DeFi from one place
Securely connect the portfolio you’re using to start.


