SOMI Crashes 17% From $1.90 Peak, Eyes Breakdown Below $1 as Traders Exit

0
0

Somnia’s native token, SOMI, has drawn strong market attention since the recent launch of its Ethereum-compatible mainnet. The excitement fueled a rapid rally, propelling the token to an all-time high of $1.90 by Sunday.
However, the surge also triggered a wave of profit-taking, which is now weighing heavily on its price and raising the risk of deeper declines.
Profit-Taking Hits SOMI After Launch Rally
Readings from the SOMI/USD four-hour chart show the token’s Money Flow Index (MFI) declining, reflecting the uptick in selloffs.
For token TA and market updates: Want more token insights like this? Sign up for Editor Harsh Notariya’s Daily Crypto Newsletter here.
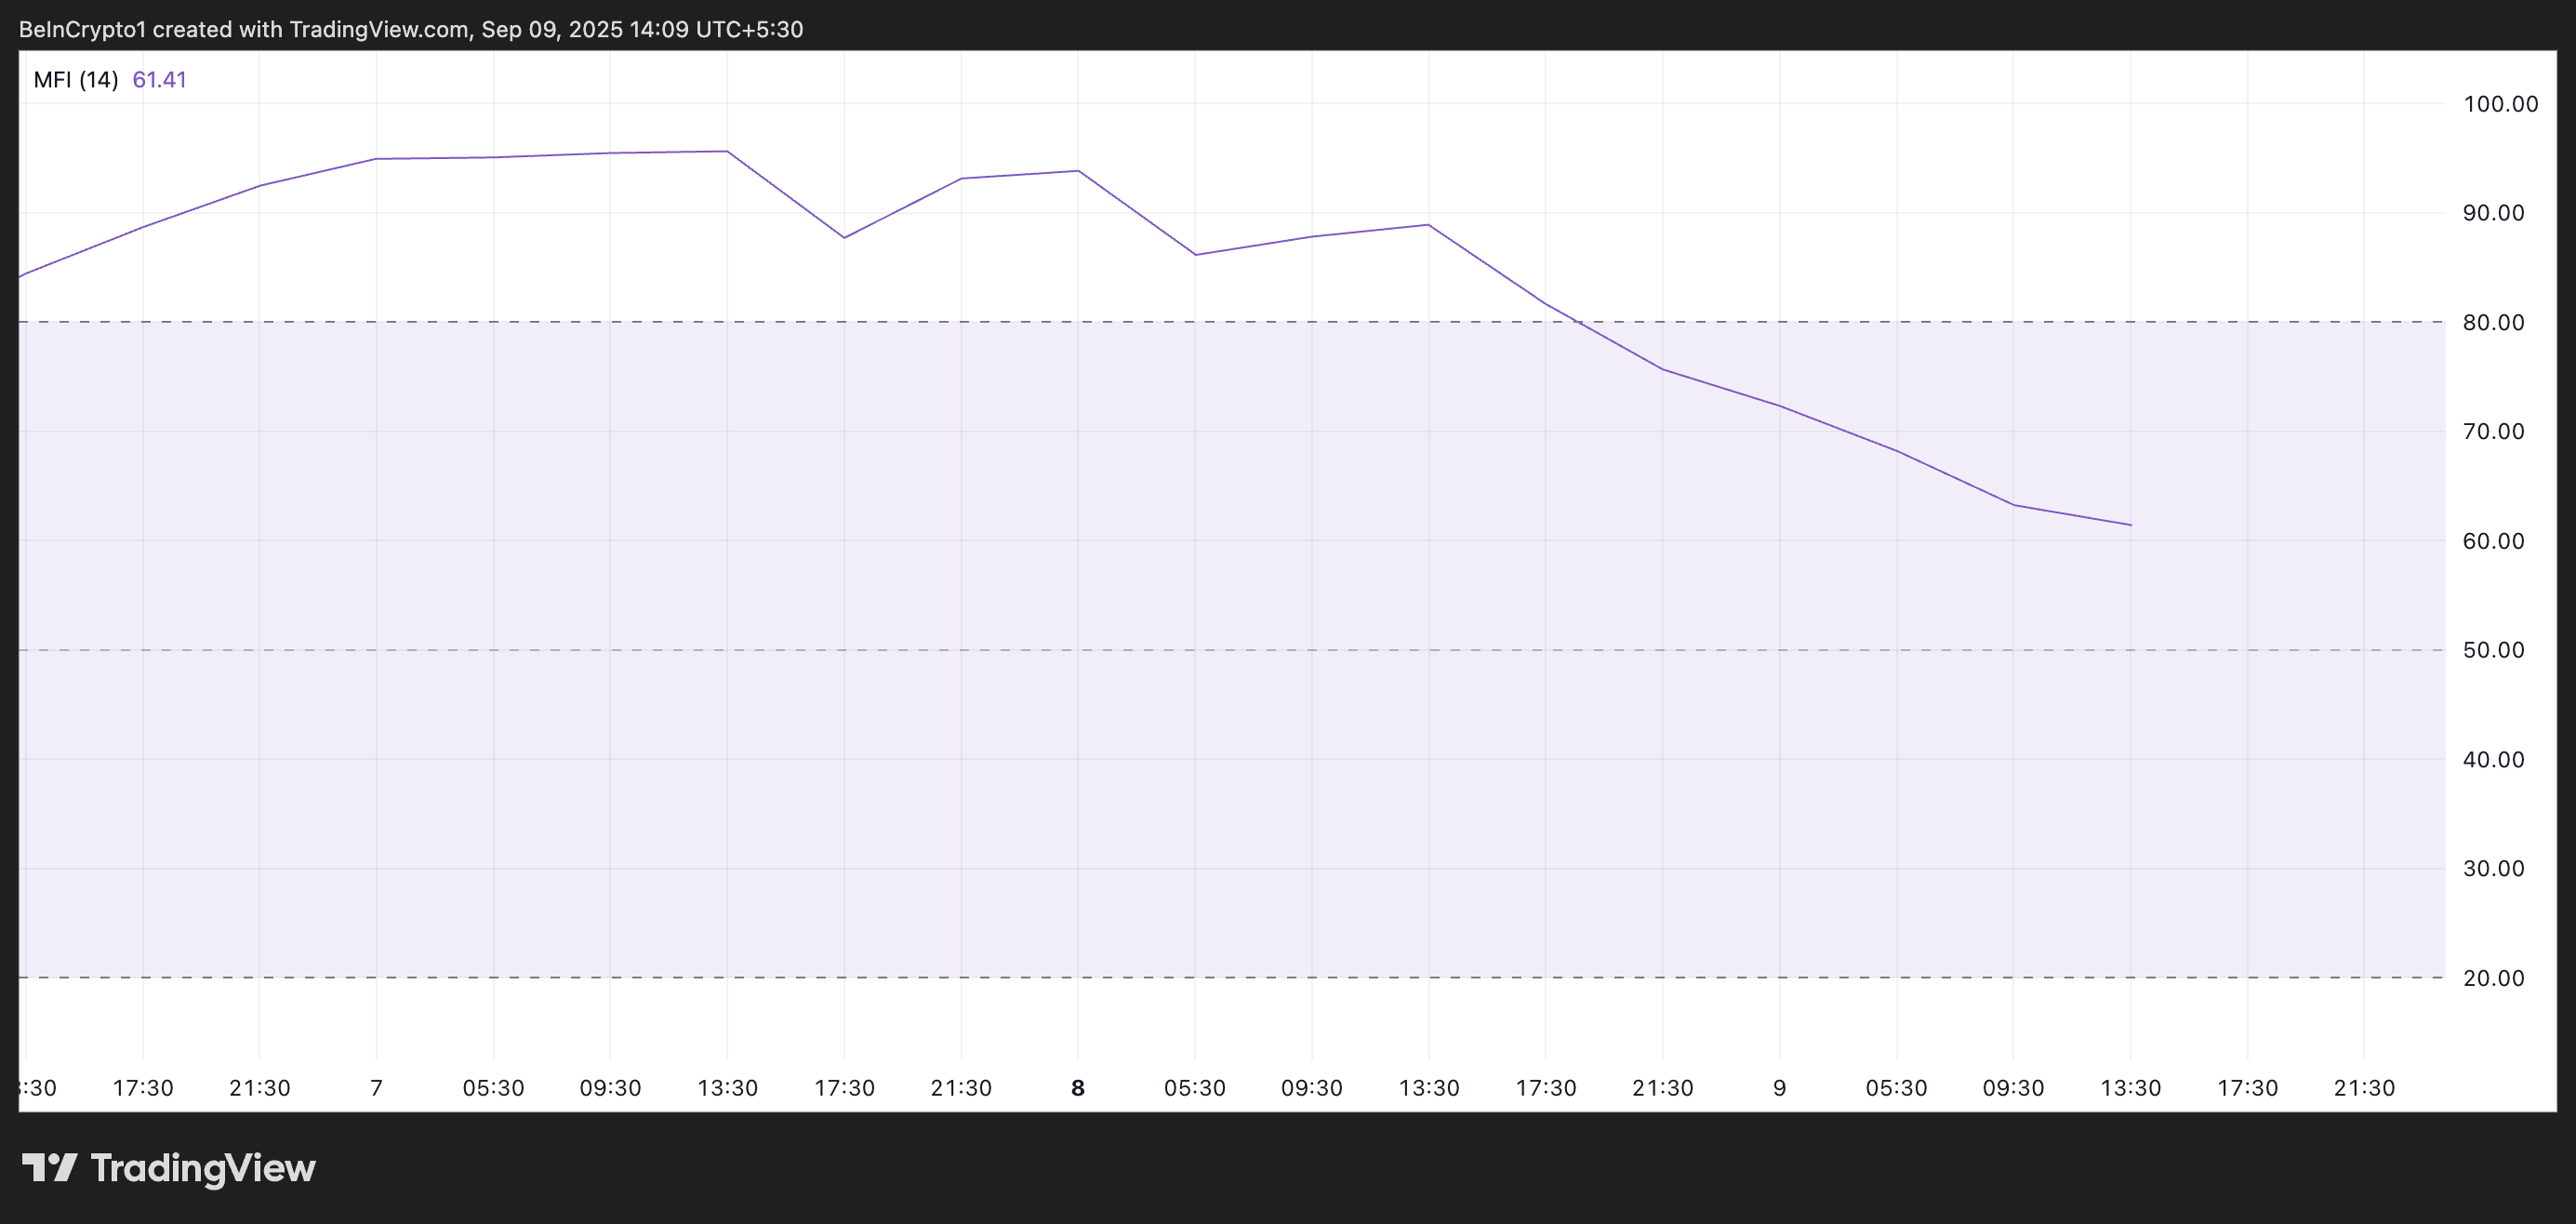 SOMI MFI. Source: TradingView
The MFI, which measures both price and trading volume to assess buying and selling pressure, climbs when capital flows into an asset and falls when outflows dominate. Therefore, SOMI’s current MFI setup highlights that buyers are losing ground, and sellers are beginning to dictate market direction.
Moreover, the token’s downward trend has pushed its price toward the 20-day exponential moving average (EMA), confirming the dip in buy-side pressure.
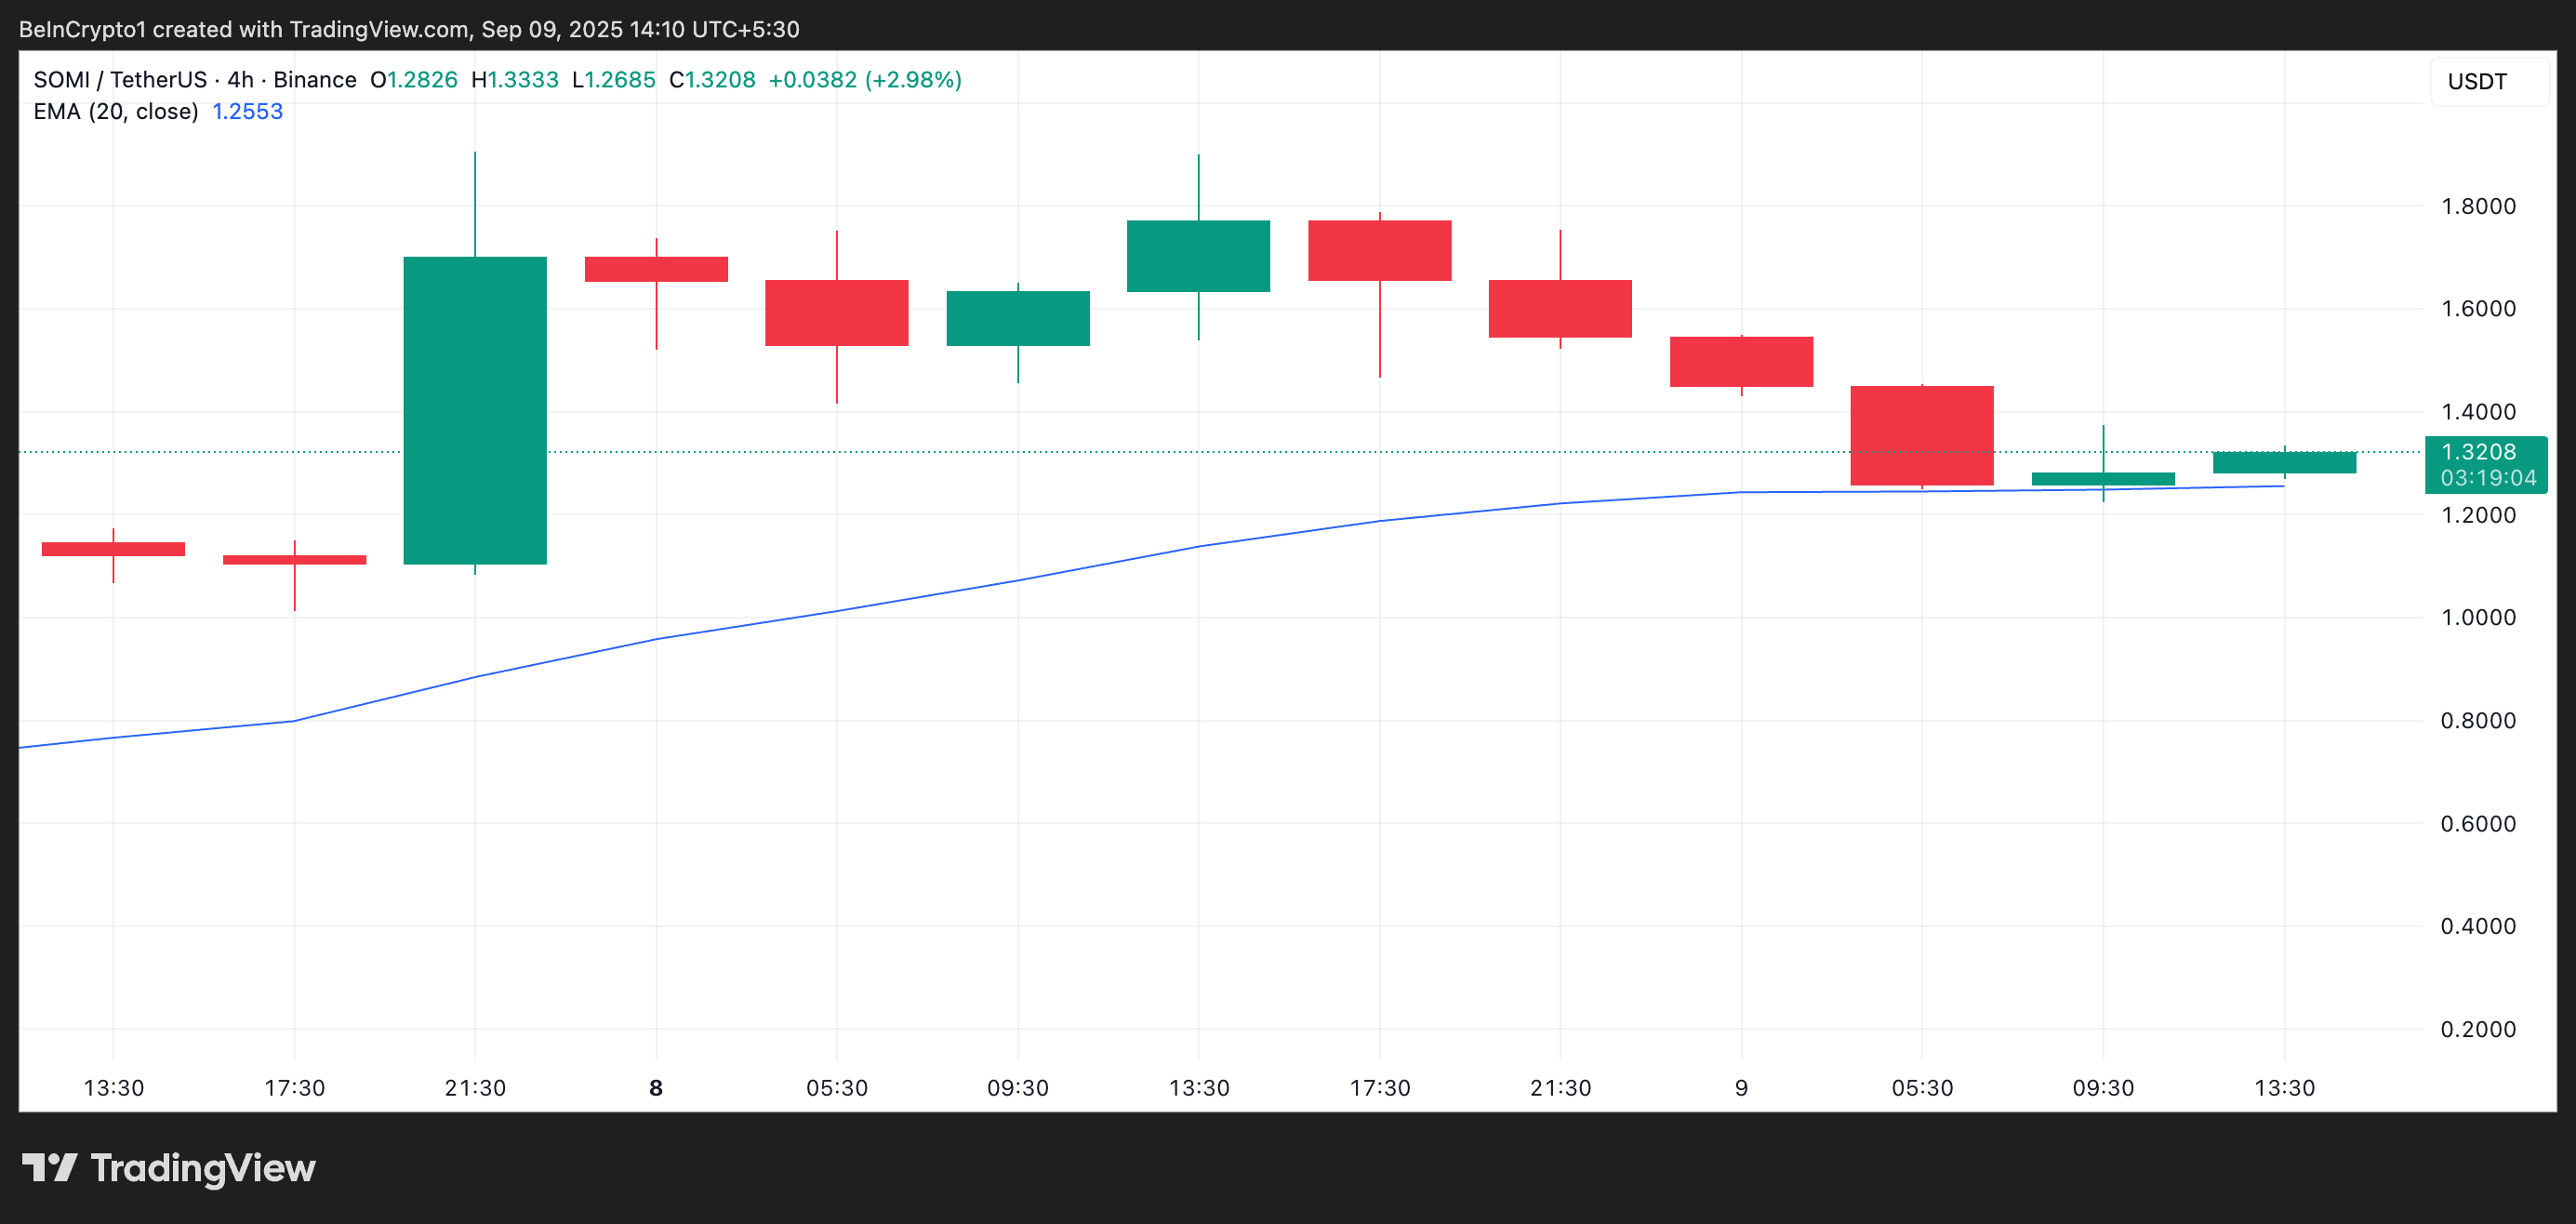 SOMI 20-Day EMA. Source: TradingView
The 20-day EMA measures an asset’s average price over the past 20 trading days, giving more weight to recent prices.
When prices consistently trade above this line, it reflects sustained buying momentum and confidence in further upside. However, a decisive breach below the EMA typically signals a shift in sentiment, as buyers lose control and bears begin to dominate.
For SOMI, slipping under this level would mark a transition from its initial post-launch bullish euphoria to a bearish phase, opening the door to deeper losses.
Furthermore, sentiment among the token’s derivatives traders has also turned bearish, reflected by its plunging futures open interest. At press time, it was $84.90 million, falling by 28% in the past 24 hours.
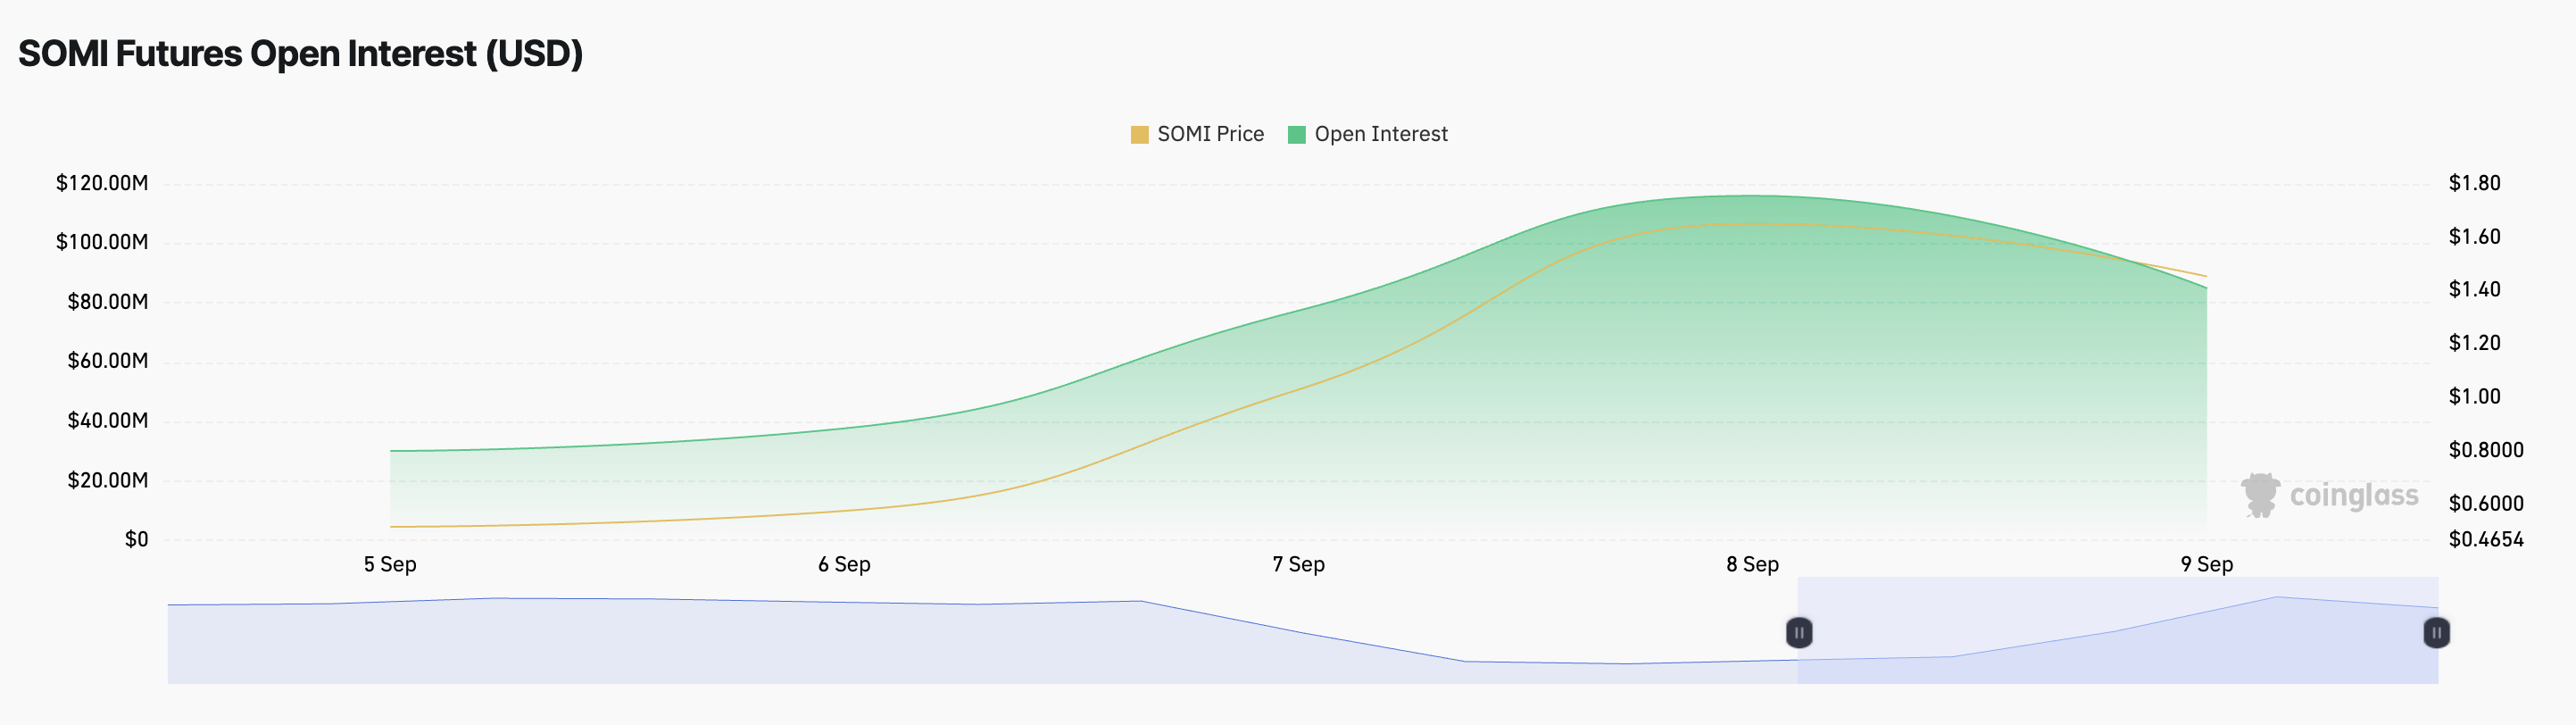 SOMI Futures Open Interest. Source: Coinglass
Open interest represents the total number of outstanding futures contracts that have not yet been settled, and it is often used to gauge the strength behind market trends.
Rising open interest signals that new money is flowing into the market, reinforcing the prevailing price direction, while a decline indicates that traders are closing positions and stepping away.
Therefore, SOMI’s falling futures open interest highlights fading appetite and a loss of confidence in its sustained upside.
SOMI Risks $0.91 if Bulls Lose $1 Support
A close below the 20-day EMA would open the door to a steeper decline to $1.10. If SOMI bulls fail to defend this level, a dip below the $1 price mark could cause the altcoin to trade at $0.91.
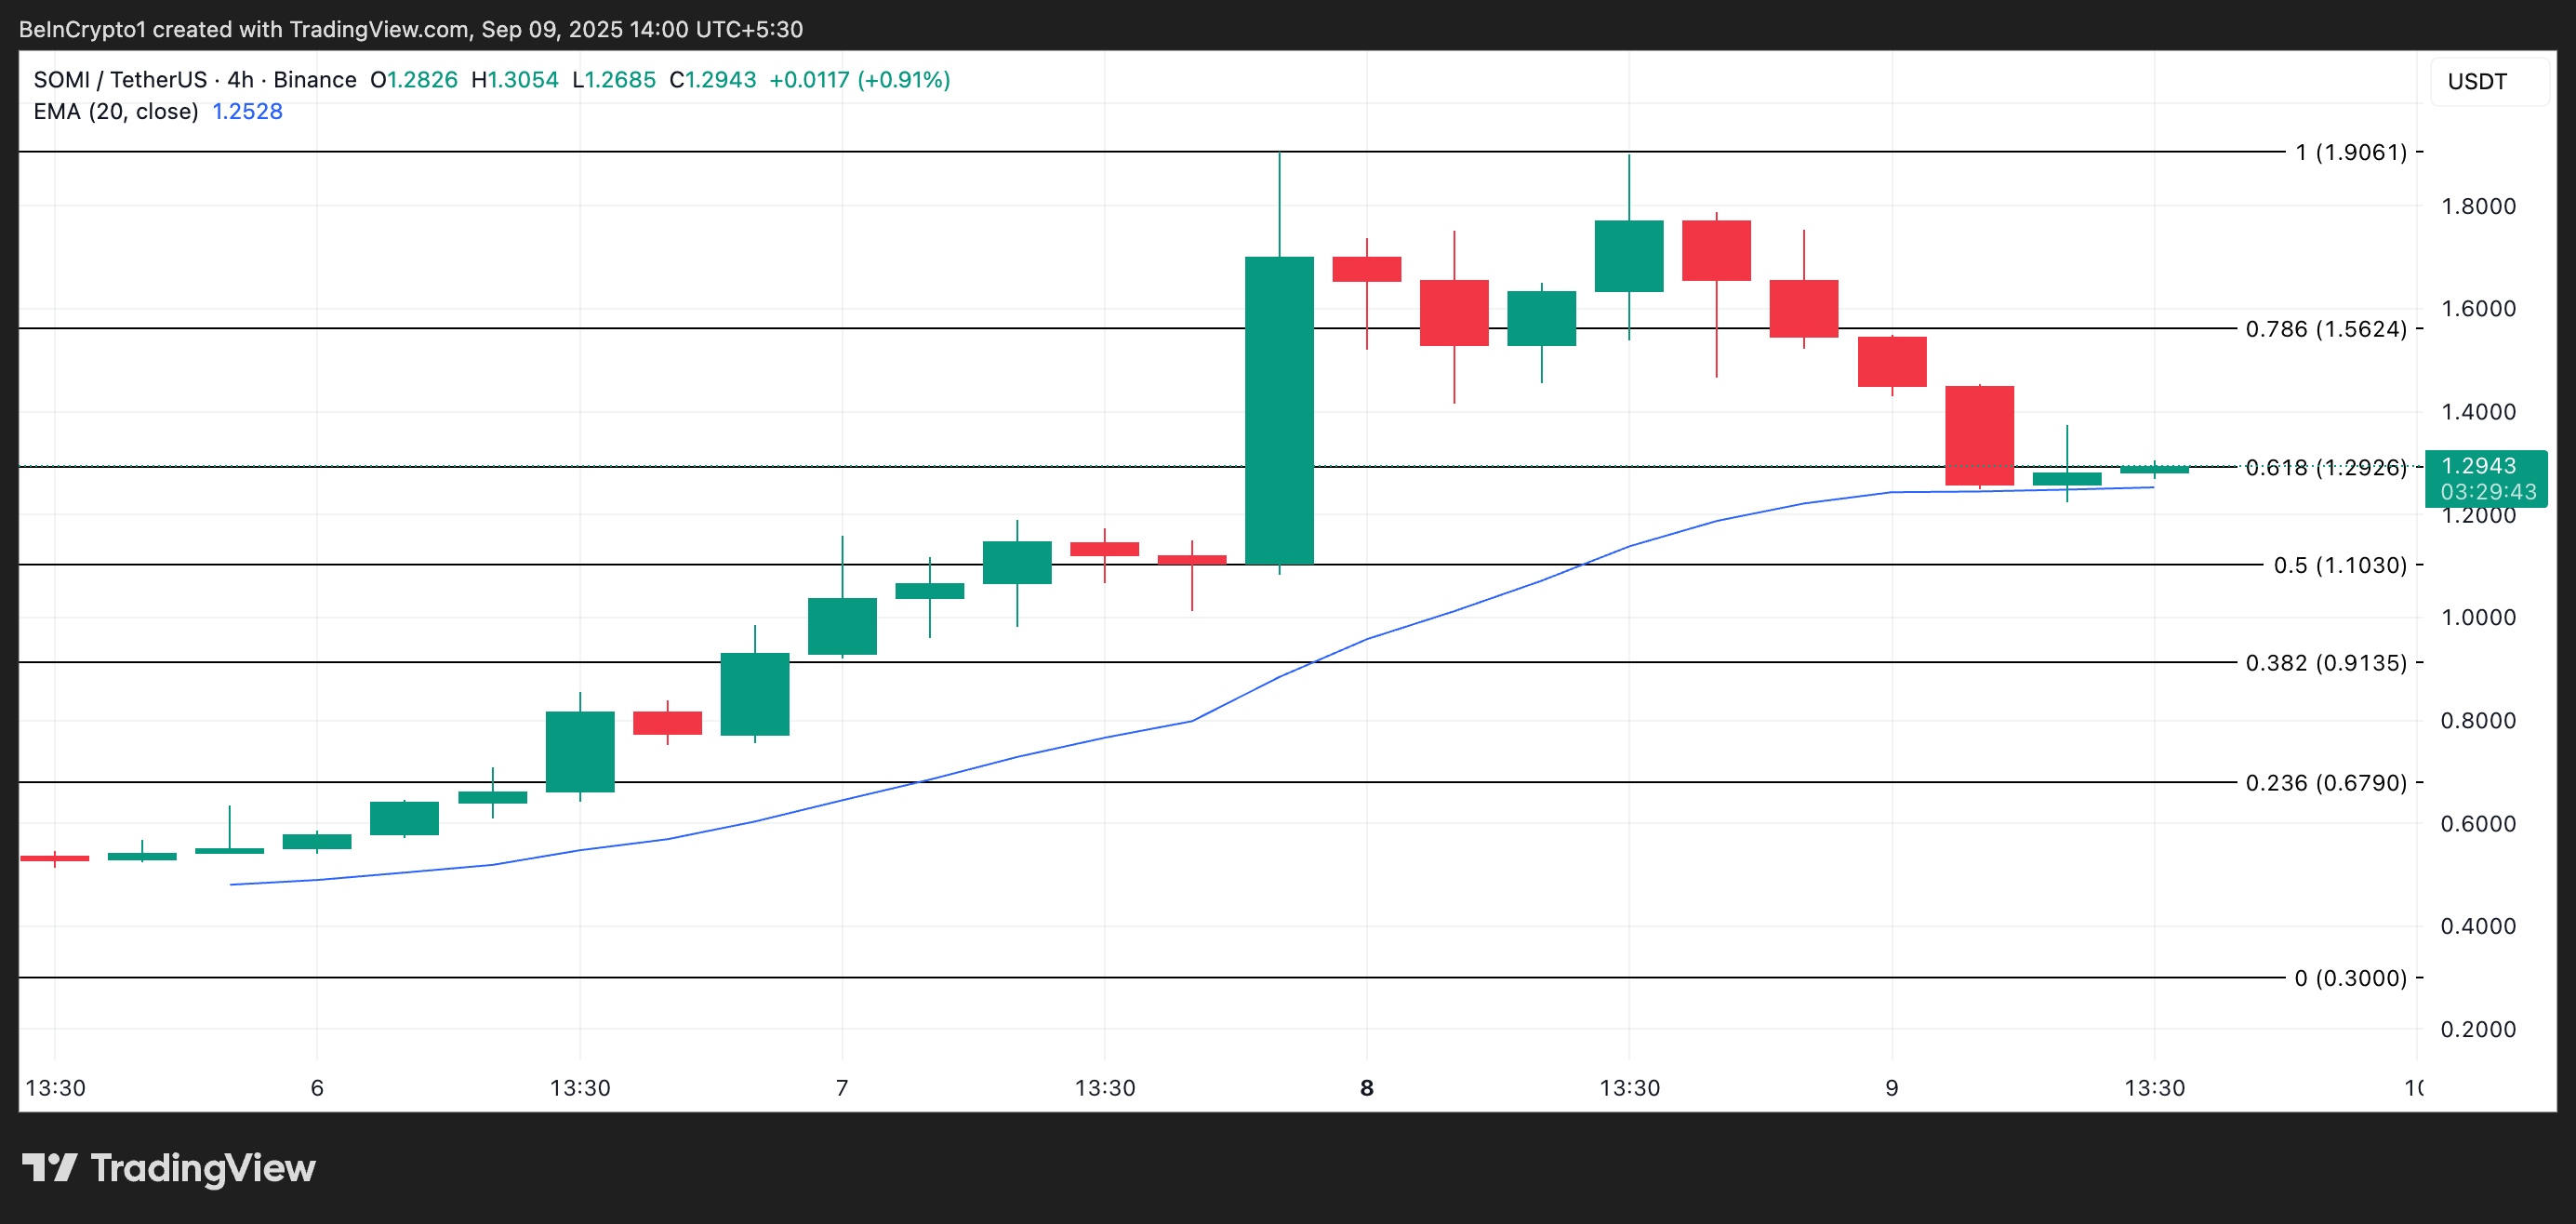 SOMI Price Analysis. Source: TradingView
However, if new demand enters the market, SOMI could regain strength and resume its uptrend toward $1.56.
0
0


 Manage all your crypto, NFT and DeFi from one place
Securely connect the portfolio you’re using to start.


0
0
