Uniswap price analysis: UNI declines to $6.36 as bears reappear
0
0

According to the Uniswap price analysis, there is more bearish pressure. Price levels have drastically decreased since the last time they peaked on March 18, 2023, at $6.53. Up until March 11, 2023, the trend was mainly downward. However, after that, the trend changed, and some improvement in price levels was seen for one week. Since March 19, bears have been attempting to regain control, and the current pattern is no exception. Bears are attempting to undo yesterday’s profits as the price of the cryptocurrency has dropped to $6.36 today.
UNI/USD 1-day price chart: Trading volumes increase by 5.41
According to Uniswap price analysis, the bulls made an effort to recover yesterday after the previous bearish strike. The bears, however, who once again prevailed on the 1-day price chart, have effectively countered the bullish momentum seen yesterday. Overall, the coin lost about 0.33 percent of its value in the previous week and is currently trading at $6.36. However, today’s trading volume has grown by 5.41 percent. The moving average (MA) is marginally lower than the market value, $6.29, as a result of recent downtrends.
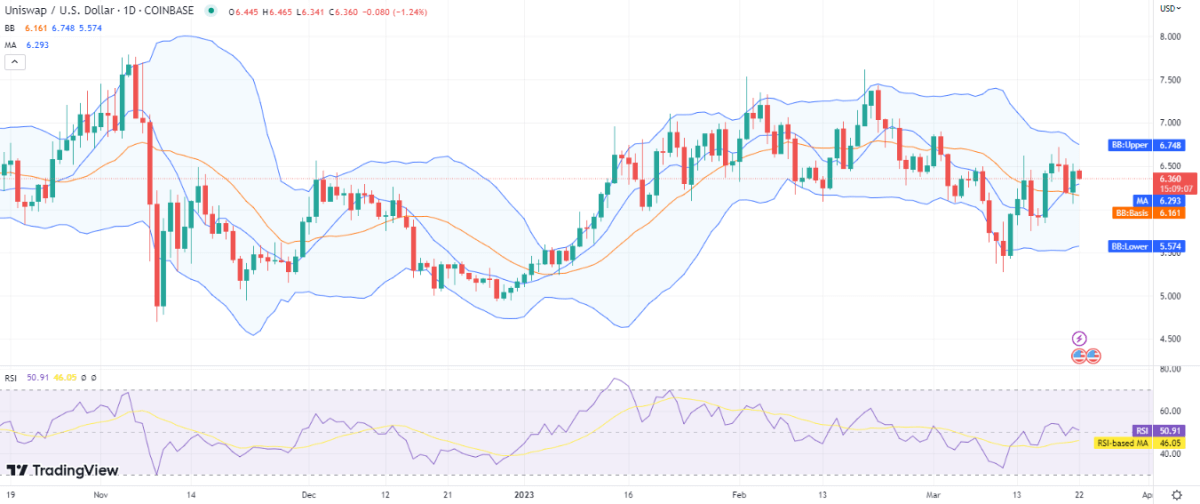
Volatility has declined as a result of the gradual convergence of the Bollinger bands. Due to this, the lower Bollinger band, which represents support for the coin, has reached a value of $5.57, and the upper Bollinger band, which represents resistance for the cryptocurrency combination, has reached a value of $6.74. The downward tendency is being confirmed once more by the Relative Strength Index (RSI), which today increased to an index of 50.
Uniswap price analysis: Recent developments and further technical indications
The coin’s price has fallen today, and the 4-hour Uniswap price analysis indicates that the bears have significantly harmed the market since the start of the current trading session. Bears are still in control of the market by lowering price levels, and they have been effective in doing so. As the bulls have not offered any support, the price is currently settling at the $6.36 mark and is continuing to fall.

In the meantime, it’s possible that the price will decrease even more over the next few hours. A significant bearish signal can be seen in the downward shift of the short-term trending line. The price level of $6.36 is just barely above the moving average. The average of the Bollinger Bands is presently sitting at $6.40.
As the upper arm of the Bollinger bands converges on the four-hour chart, the volatility is reducing. As a result, the upper Bollinger band has reached a value of $6.65, and the lower Bollinger band has reached a value of $6.14. The RSI neutral range’s precise center, index 50, where the RSI indicator is currently located, is in the lower half of the neutral range.
Uniswap price analysis
The one-day and four-hour Uniswap price analysis shows that the bears are presently winning the game. Uniswap’s price has dropped, and as of this writing, it is $6.36. The market appears to be returning to its downward pattern, which is expected to continue into the future. In the ensuing hours, the price might decrease even more.
0
0

 Manage all your crypto, NFT and DeFi from one place
Securely connect the portfolio you’re using to start.

0
0


