Price Analysis: STX, DIA, and LOOM - Where Are the Top 3 Coins to Watch Heading?
11
0
Bitcoin saw a turbulent few days after dropping by a sharp 25% yesterday to reach as low as $30,300 before rebounding during the day to close the daily candle at around $35,550. The sharp drop introduced a level of fear in the market after a month of new ATHs being created on a daily basis.
At the same time, altcoins took a nosedive, and many of them are on the road to recovering today.
Yesterday, we released our top coins to watch for this week, which included Blockstack, DIA, and Loom Network.
In this analysis, I would like to cover these three coins to help provide some support and resistance levels to keep an eye on moving forward.
Blockstack (STX) price analysis
What has been going on?
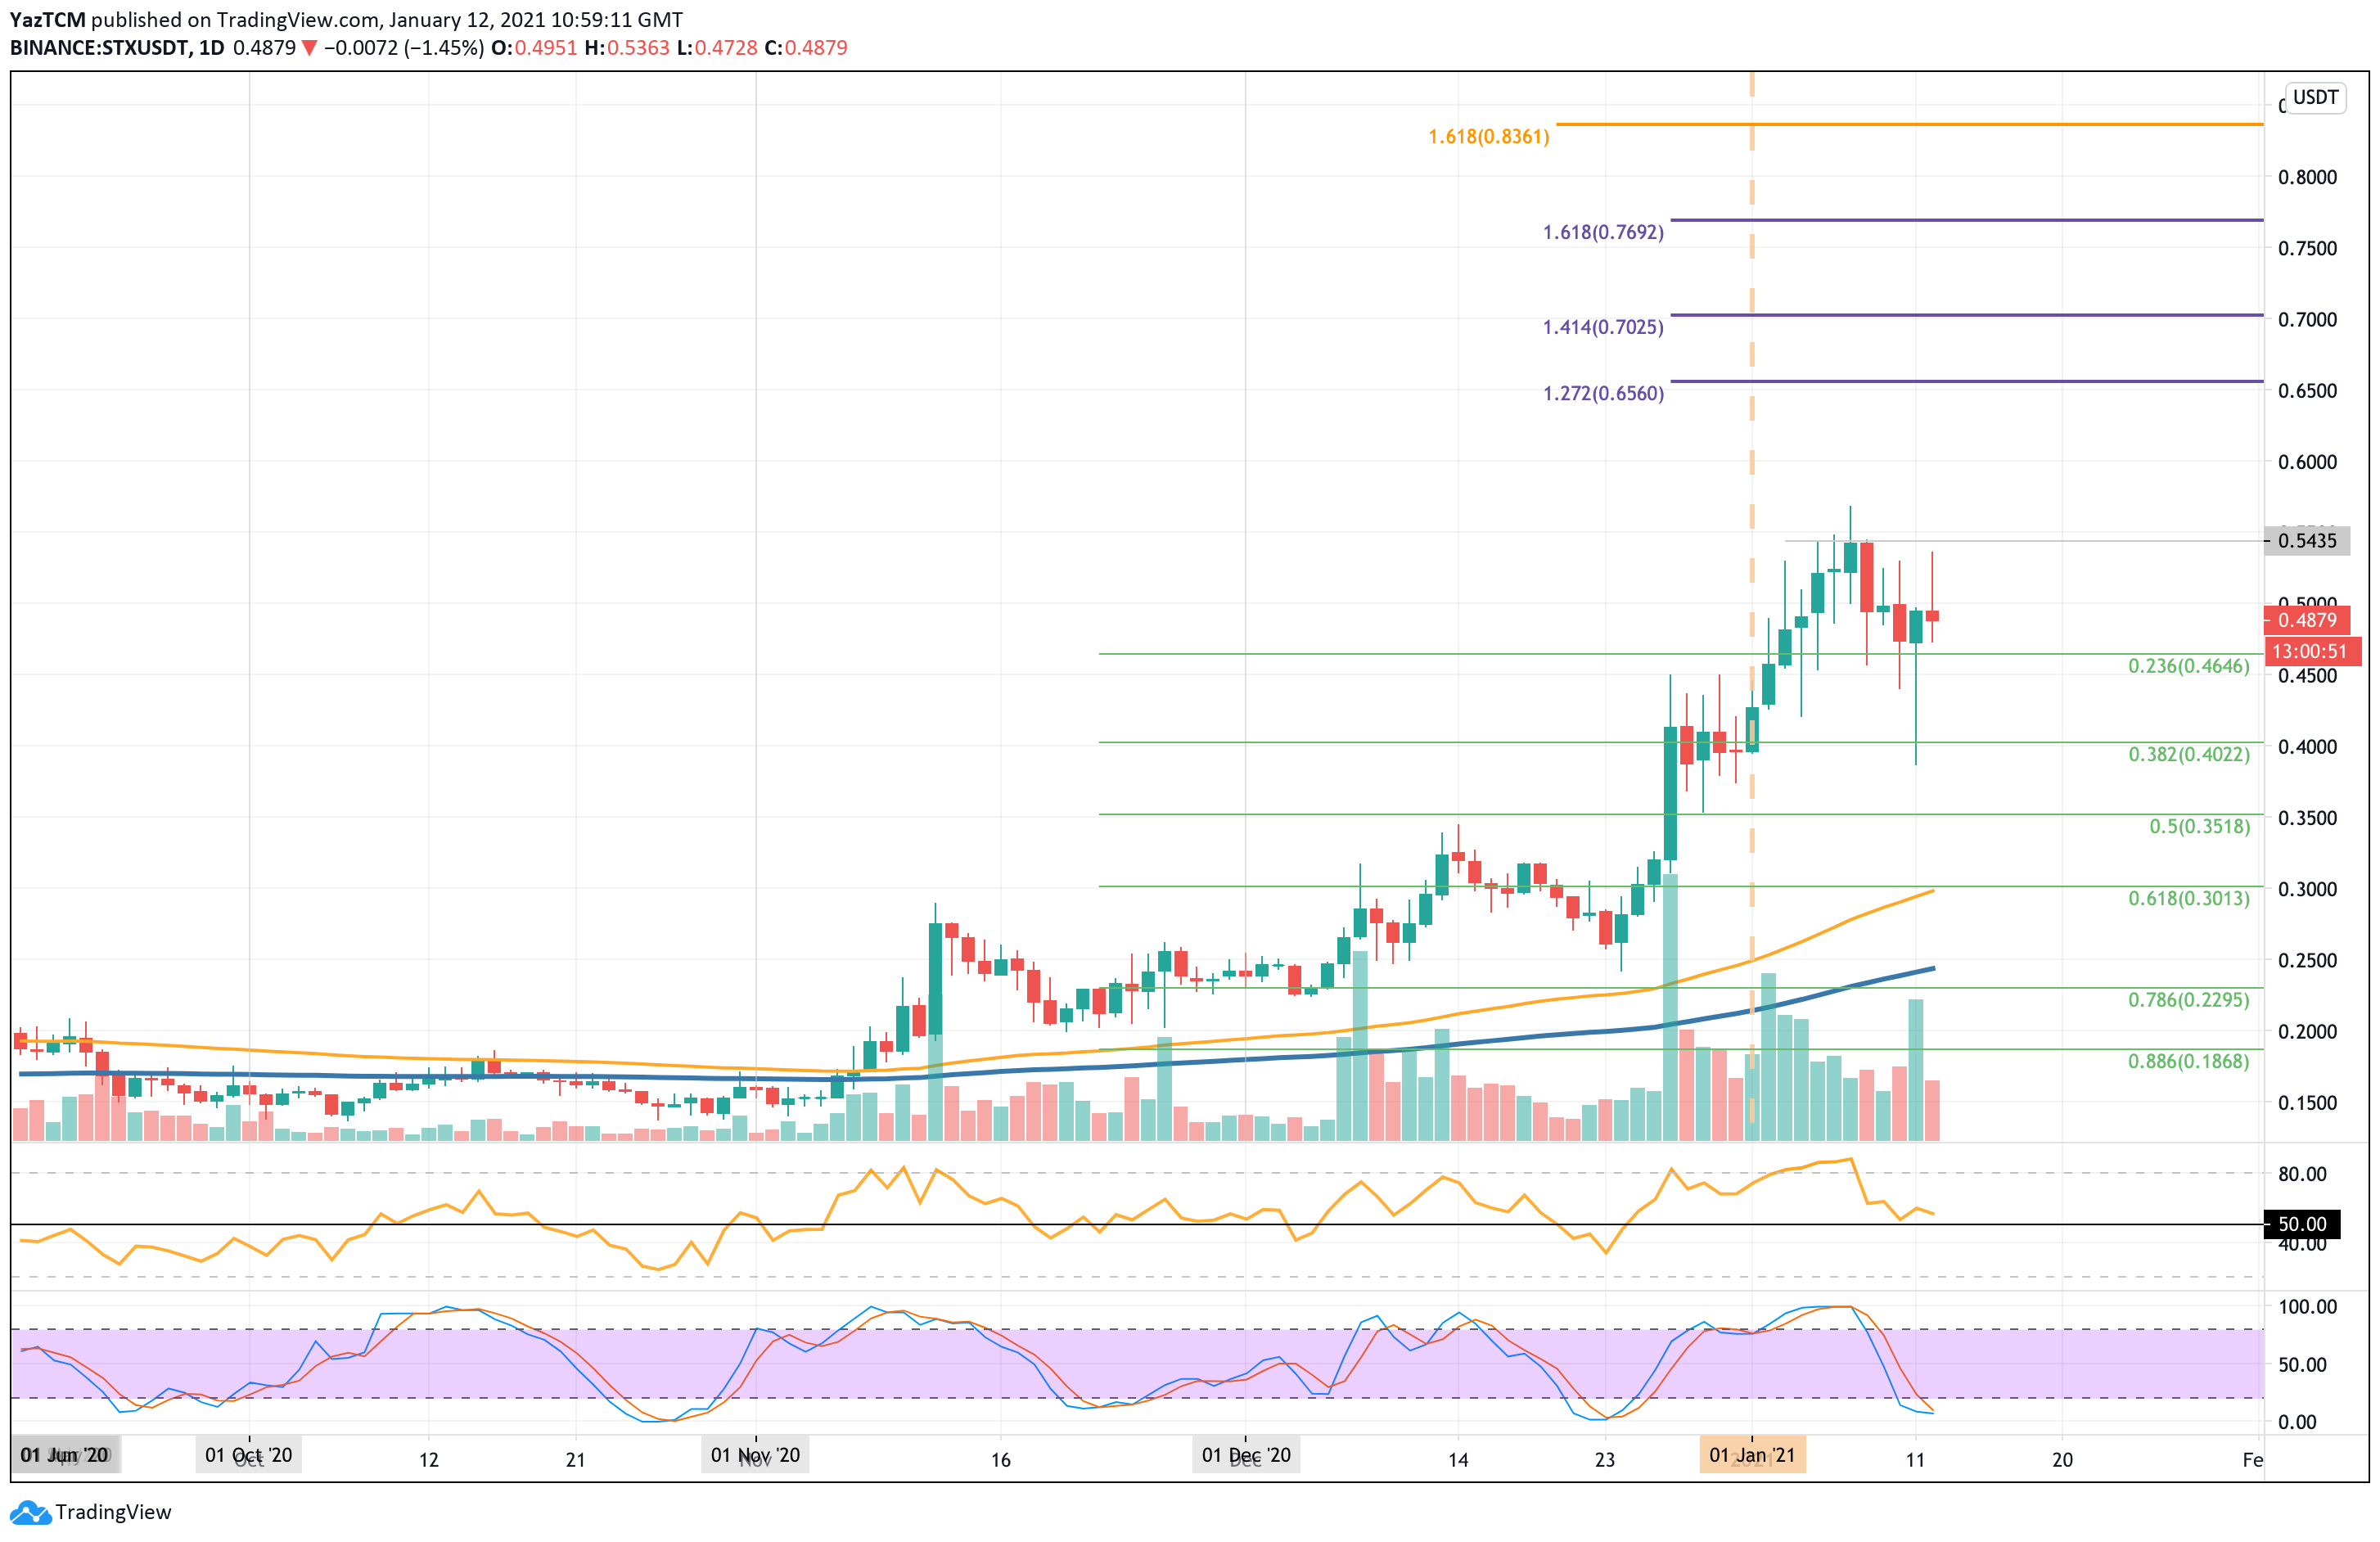
Blockstack saw an impressive 81% price surge over the past month as the cryptocurrency bounced from the $0.25 level to reach as high as $0.56 last week. It has since dropped slightly to trade at around $0.487.
The coin surged higher over the past week in January 2021 as it pushed from $0.4 to reach the resistance at $0.55. It was never able to close above this resistance and started to head lower last week.
Yesterday, during the strong market drop, STX fell as low as $0.38. Luckily, the bulls had pushed higher by the end of the day to allow the daily candle to close above support at $0.4646 (.236 Fib Retracement).
STX price short-term prediction: Bullish
After an 81% surge over the past month, STX is considered bullish right now. The coin would need to drop beneath $0.3 (.618 Fib & 100-day EMA) to turn neutral and would have to continue further beneath $0.25 (200-day EMA) to turn bearish.
If the sellers push lower, the first level of support lies at $0.4646 (.236 Fib Retracement). This is followed by support at $0.4 (.382 Fib Retracement), $0.351 (.5 Fib), and $0.30 (.618 Fib Retracement & 100-day EMA). Added support lies at $0.25 (200-day EMA), and $0.229 (.786 Fib).
Where is the resistance toward the upside?
On the other side, the first level of resistance lies at $0.5. This is followed by resistance at $0.543, $0.58, and $0.6.
Beyond $0.6, resistance is located at $0.65 (1.272 Fib Extension), $0.7 (1.414 Fib Extension), $0.75, AND $0.769 (1.618 Fib Extension). This is followed by $0.8 and $0.836.
Dia (DIA) Price Analysis
What has been going on?
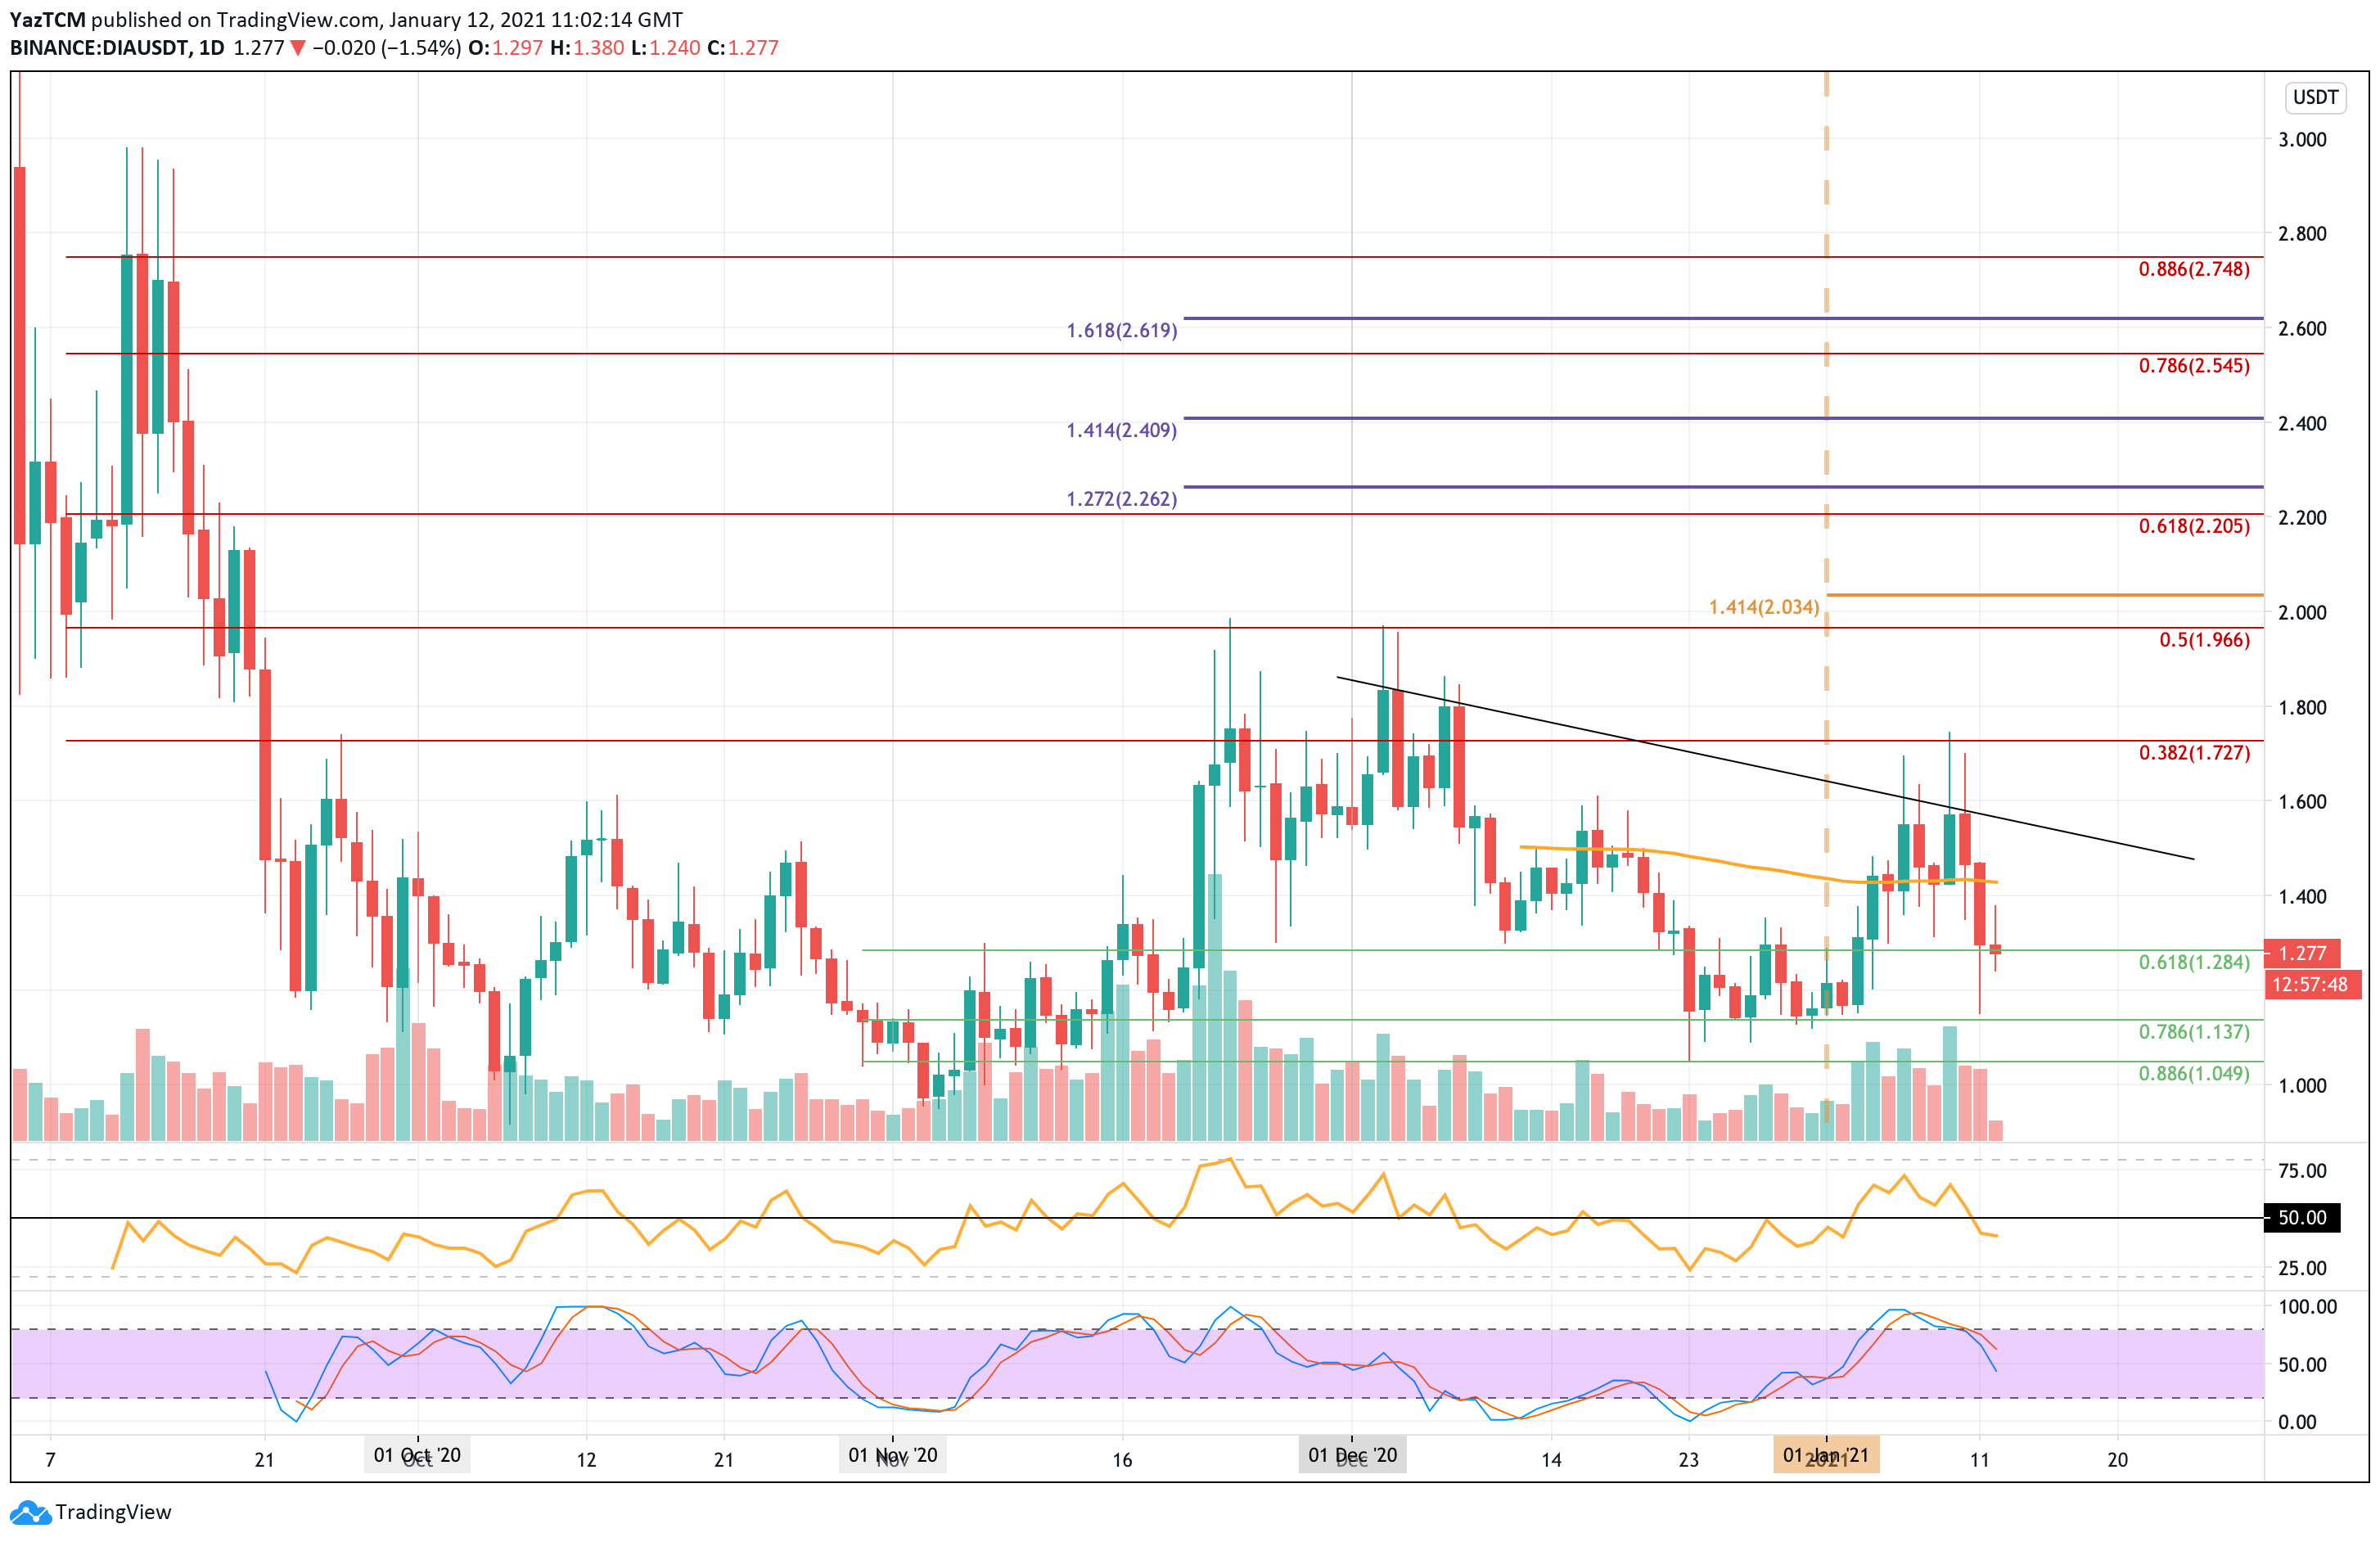
DIA is down by a total of 8.3% over the past week of trading as it currently trades around $1.27. The cryptocurrency fell lower from resistance at $1.96 (bearish .5 Fib Retracement) at the start of December and continued to head lower until support was found at $1.13 (.786 Fib Retracement).
It rebounded from this support at the start of January but was unable to overcome the resistance at $1.60, further bolstered by a falling trend line. It has since dropped lower and is trading near $1.28 - support provided by a .618 Fib Retracement.
DIA price short-term prediction: Neutral
DIA is considered neutral right now. The cryptocurrency would need to break beyond $1.96 (December highs) to turn bullish in the short term. On the other side, a drop beneath $1.05 (December lows) would turn the market bearish.
If the sellers push lower, the first level of support lies at $1.20. This is followed by support at $1.13 (.786 Fib), $0.105 (.886 Fib), and $1.00
Where is the resistance toward the upside?
On the other side, the first level of resistance lies near $1.40 (100-day EMA). This is followed by resistance at the falling trend line, $1.60, and $1.72 (bearish .382 Fib Retracement). If the bulls continue to drive higher, resistance is found at $1.80, $1.96 (bearish .5 Fib Retracement & December high), $2.03, and $2.20 (bearish .618 Fib Retracement).
Loom Network (LOOM) price analysis

What has been going on?
LOOM also saw a whopping 88% price surge over the past month of trading as the coin currently trades at $0.0469. It started the year by rebounding from support at $0.025 as it started to surge higher into resistance at $0.06 - provided by a bearish .618 Fibonacci Retracement level.
Although it managed to spike above this resistance, it could not close a daily candle above it. Over the past week, LOOM headed lower until support was found at $0.0351 (.618 Fib Retracement). It has since bounced higher from this support and is not trading at $0.0469.
LOOM price short term prediction: Neutral
LOOM is bullish right now. The coin would need to drop beneath $0.035 (.618 Fib) to turn neutral and further beneath $0.025 (200-day EMA & .786 Fib) to turn bearish.
If the sellers push lower, the first level of support lies at $0.0416 (.5 Fib Retracement). This is followed by support at $0.04, $0.0351 (.618 Fib), and $0.03 (100-day EMA). Added support lies at $0.0258 (200-day EMA & .786 Fib Retracement).
Where is the resistance toward the upside?
On the other side, the first level of resistance lies at $0.05. This is followed by resistance at $0.0535 (August 2020 high), $0.06 (bearish .618 Fib Retracement), and $0.065. Beyond $0.07, added resistance lies at $0.0739 (bearish .786 Fib Retracement), $0.08, and $0.0824 (bearish .886 Fib Retracement).
11
0


 Manage all your crypto, NFT and DeFi from one place
Securely connect the portfolio you’re using to start.

0
0


0
0
