SUI Price Prediction 2024-2030: Is SUI A Good Investment?

0
0

Key Takeaways
- Our SUI price prediction indicates a high of $1.60 by the end of 2024.
- In 2025, SUI will range between $1.88 and $2.35, with an average price of $1.94.
- In 2030, it will range between $12.70 and $15.09, with an average price of $13.06.
SUI is the native token of the Sui blockchain and governs and settles fees on the blockchain. Users can stake their SUI tokens with validators in a Delegated Proof-of-Stake model, enabling active participation in consensus and potential rewards. SUI’s notable feature is its ability to achieve parallel agreement on independent transactions, leading to enhanced scalability.
Is SUI a good investment? Will it go up? Where will it be in five years? Our SUI Cryptopolitan Price Prediction answers these questions and more.
Overview
| Cryptocurrency | Sui |
| Ticker | SUI |
| Current Price | $1.07 |
| Market Cap | $2,514,306,153 |
| Trading Volume | $121,918,189 |
| Circulating Supply | 2,339,196,966 |
| All-time High | $2.18, on Mar 27, 2024 |
| All-time Low | $0.3643 on Oct 19, 2023 |
| 24-hour High | $1.07 |
| 24-hour Low | $1.03 |
SUI Price Prediction: Technical Analysis
| Metric | Value ($) |
| Volatility (30-day Variation) | 6.47% |
| 50-day SMA | $1.209 |
| 200-day SMA | $1.165 |
| Sentiment | Bearish |
| Fear & Greed Index | 74 (Greed) |
| Green Days | 11/30 (37%) |
SUI Price Analysis: SUI remains range-bound through May.
Key Takeaways:
- A break below $1 will send it to Bitcoin pre-halving levels.
- SUI is reversing on the 4-hour timeframe.
SUI/USD 1-day Chart: Market reverses from the annual high
The daily chart highlights SUI’s breakout in March following market FOMO from Bitcoin’s halving. The market quickly reversed afterward. A break below $1 will send it to pre-halving levels. It has remained range-bound through May.

SUI/USD 4-hour Chart: Positive momentum rises
This chart shows it is in a downtrend. It has formed bullish, engulfing candles over the last eight hours. Positive momentum has also risen, targeting the 23.60 Fibonacci at $1.0979.

SUI Technical Indicators: Levels and Action
Daily Simple Moving Average (SMA)
| Period | Value ($) | Action |
| SMA 3 | 1.091 | SELL |
| SMA 5 | 1.098 | SELL |
| SMA 10 | 1.114 | SELL |
| SMA 21 | 1.066 | SELL |
| SMA 50 | 1.209 | SELL |
| SMA 100 | 1.443 | SELL |
| SMA 200 | 1.165 | SELL |
Daily Exponential Moving Average (EMA)
| Period | Value ($) | Action |
| EMA 3 | 1.070 | SELL |
| EMA 5 | 1.080 | SELL |
| EMA 10 | 1.111 | SELL |
| EMA 21 | 1.189 | SELL |
| EMA 50 | 1.337 | SELL |
| EMA 100 | 1.359 | SELL |
| EMA 200 | 1.214 | SELL |
What can you expect from SUI Price Analysis next?
Our indicators show a bearish sentiment, while the Fear & Greed Index shows 74 (Greed). SUI recorded 11/30 green days with 6.47% price volatility over the last 30 days. The chart analysis shows it will trade higher over the short term.
Is SUI a Good Investment?
The SUI has utility, and ongoing developments and partnerships will lead to a more efficient network. SUI is a victim of the crypto market dynamics but continues to scale higher. As per the Cryptopolitan price predictions, SUI will set record prices in the coming years.
Recent News/ Updates
- SUI is partnering with MESH to integrate its technology. The technology enables the shameless transfer of digital assets and allows for account aggregation.
SUI Price Prediction June 2024
A break above resistance will result in a mini bull run with the next target at $1.09. The price will range between $0.89 and $1.30.
| Month | Potential Low | Potential Average | Potential High |
| June | 0.89 | 1.09 | 1.30 |
Also read: Sui Sets New Standard for Blockchain Transaction Speeds
SUI Price Prediction 2024
The price predictions for SUI for the second half of 2024 are bullish. It will trade between $0.89 and $1.60 and average $1.39.
| Year | Potential Low ($) | Potential Average ($) | Potential High ($) |
| 2024 | 0.89 | 1.39 | 1.60 |
SUI Price Predictions 2025-2030
| Year | Potential Low ($) | Potential Average ($) | Potential High ($) |
| 2025 | $1.88 | $1.94 | $2.35 |
| 2026 | $2.80 | $2.87 | $3.27 |
| 2027 | $4.23 | $4.34 | $4.89 |
| 2028 | $6.20 | $6.37 | $7.45 |
| 2029 | $8.82 | $9.08 | $10.40 |
| 2030 | $12.70 | $13.06 | $15.09 |
SUI Price Prediction 2025
The SUI forecast for 2025 indicates a high of $2.35. In a correction, SUI might rest at a minimum price of $1.88, making an average price of $1.94.
SUI Price Prediction 2026
The year 2026 will experience more bullish momentum. According to the SUI price prediction, it will range between $2.80 and $3.27, with an average trading price of $2.87.
SUI Price Prediction 2027
The SUI’s price prediction climbs higher into 2027. According to the prediction, it will range between $4.23 and $4.89, with an average of $4.34.
SUI Price Prediction 2028
According to the SUI price prediction, SUI will range between $6.20 and $7.45, with an average of $6.37.
SUI Price Prediction 2029
According to the SUI coin price prediction for 2029, the SUI price will reach a maximum and minimum cost of $10.40 and $8.82, respectively, with an average of $9.08.
SUI Price Prediction 2030
The SUI coin price prediction 2030 indicates a price range of $12.70 and $15.09 and an average price of $13.06.

SUI Market Price Prediction: Analysts’ SUI Price Forecast
| Firm | 2024 | 2025 |
| DigitalCoinPrice | $2.35 | $2.76 |
| Changelly | $1.67 | $2.50 |
| Gate.io | $1.14 | $1.19 |
Cryptopolitan’s SUI Price Prediction
SUI has dropped 34% from its initial listing price. At current levels, it is bullish despite dropping 20% in the last 30 days.
According to our predictions, it will achieve a high of $1.60 in the second half of 2024. In 2025, it will range between $1.88 and $2.35, with an average price of $1.94. In 2030, it will trade between $12.70 and $15.09.
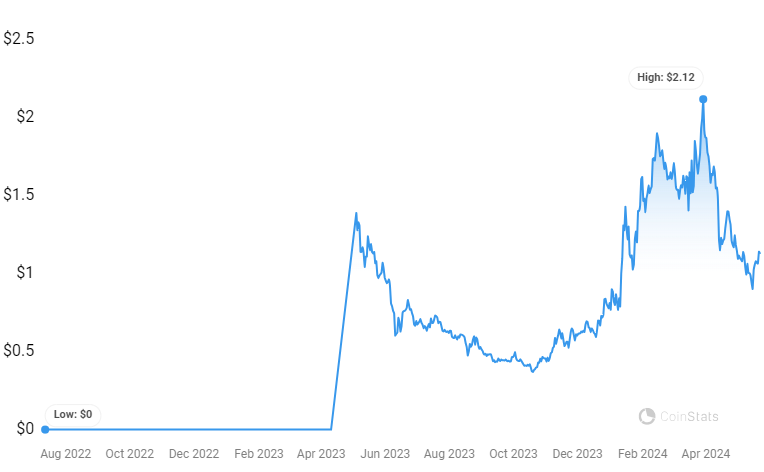
SUI Historic Price Sentiment
- The SUI pre-sale price was $0.03 on three exchanges: OKX, KuCoin, and ByBit. You can trade SUI on those exchanges.
- The public sale- held in May 2023- price was $0.10, capped at 10,000 tokens per person.
- According to Coinmarketcap, SUI started trading at $1.4. A bear run preceded it, and on October 23, 2023, it fell to its lowest price, $0.3643.
- It started recovering after October. It reached its highest price on March 27, 2024, at $2.18.
- On May 21, 2024, SUI surpassed 1 million daily active wallets.
0
0

 Manage all your crypto, NFT and DeFi from one place
Securely connect the portfolio you’re using to start.


0
0
