Why Is The Crypto Market Down Today?

0
0

The total crypto market capitalization slipped to $2.39 trillion on April 13, marking a 27% decline from its January 2026 peak of $3.29 trillion.
The sell-off has dragged Bitcoin (BTC) below $71,000. However, Dash (DASH) showed divergence after a sharp rally and correction.
In the News Today:
- The US military began enforcing a naval blockade on Iranian ports on April 13, sending oil prices surging and triggering a broad risk-off move across crypto markets.
- Analysts warned that rising defaults in private credit could trigger a financial crisis similar to 2008, with redemption requests topping $20 billion in Q1 2026.
- Crypto markets dipped on Sunday ahead of a sharp Monday stock sell-off, extending a pattern of weekend weakness bleeding into traditional market hours.
Total Market Cap Struggles Below Key Fibonacci Level
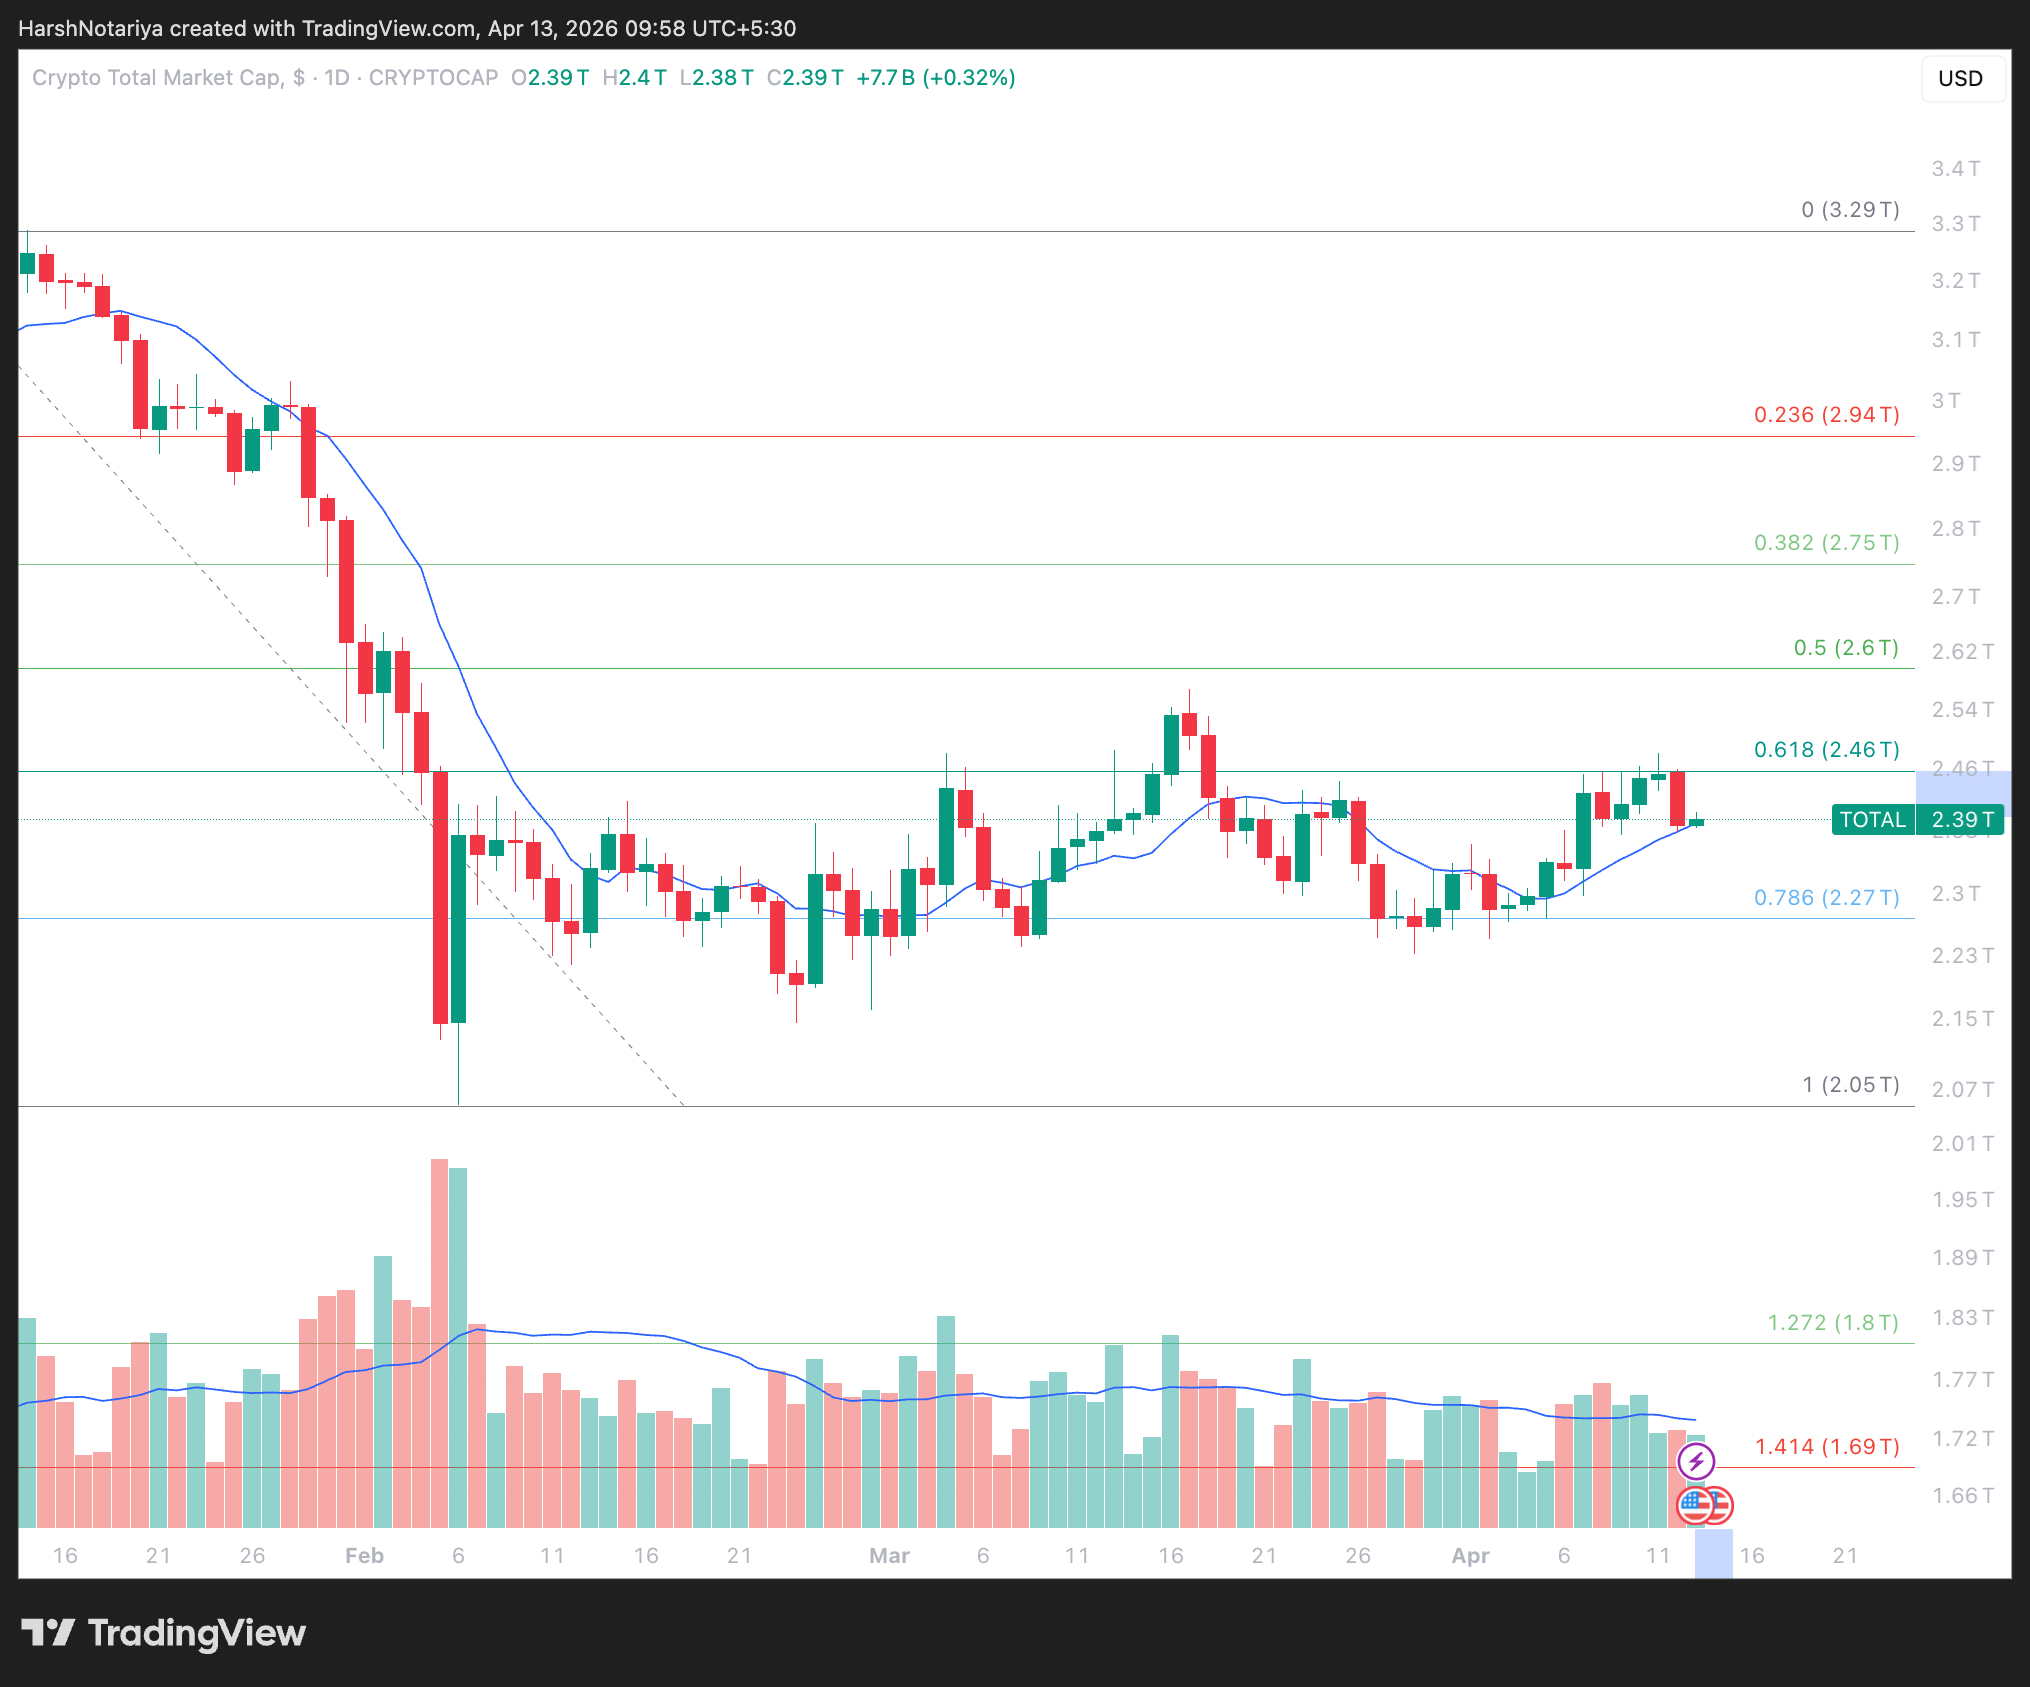
The total crypto market cap daily chart reveals a sustained downtrend since late January. After peaking near $3.29 trillion, the market fell through multiple Fibonacci levels. It now trades at $2.39 trillion, losing $61 billion over the past 24 hours.
This places TOTAL just below the 0.618 Fibonacci level at $2.46 trillion. This is an important resistance that bulls have failed to reclaim. If bulls successfully reclaim the $2.46 trillion level, the next challenge is at $2.6 trillion.
 TOTAL Price Analysis. Source: TradingView
The 10-day Simple Moving Average (SMA) provides immediate support, hovering near $2.39 trillion.
If selling pressure continues, the next support sits at the 0.786 level near $2.27 trillion. A breakdown below that could expose the full retracement target of $2.05 trillion. Bulls would need a daily close above $2.46 trillion to reverse the trend.
BTC Price Prediction. Can $71,000 Hold?
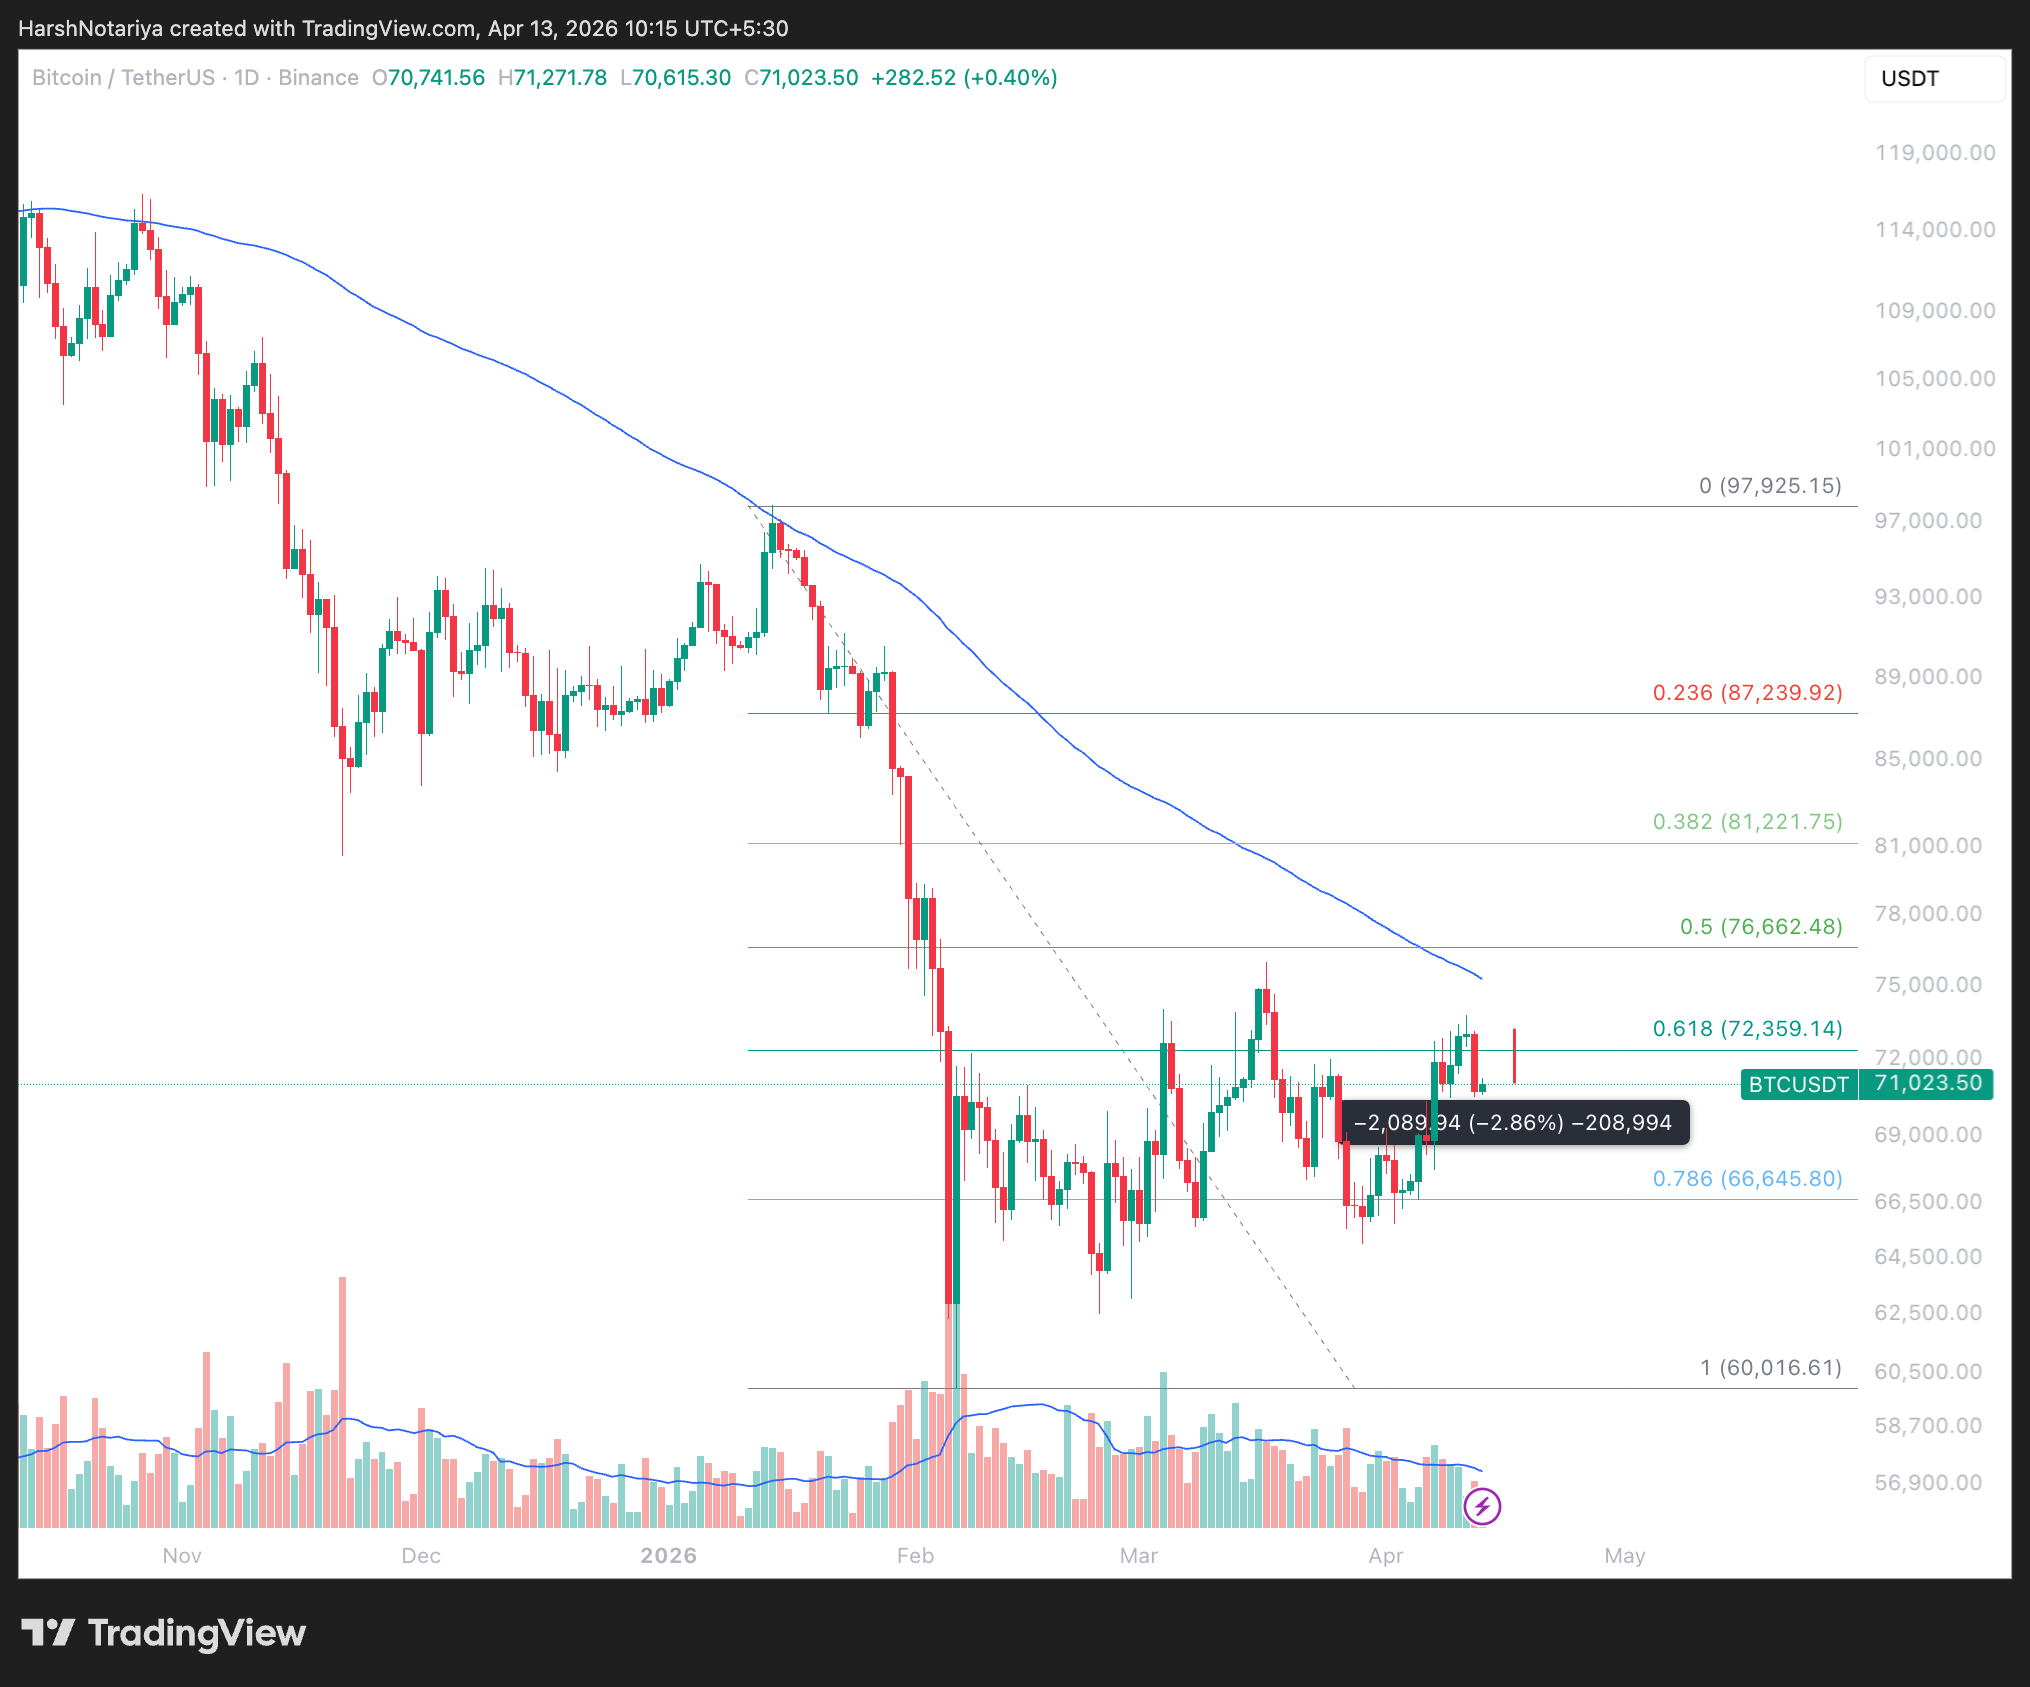
Bitcoin’s daily chart paints a clear picture of the 2026 downtrend. BTC trades at $71,023, down 2.86% from Sunday’s highs. It sits just below the 0.618 Fibonacci retracement at $72,359.
Fibonacci levels from the $60,016 swing low to $97,925 swing high place BTC deep in the retracement zone.
If BTC loses the $71,000 level, the next support appears at the 0.786 Fibonacci level near $66,645. That would represent roughly a 6% decline from current prices.
 Bitcoin Price Analysis. Source: TradingView
The 100-day SMA slopes downward above the current price, reinforcing the bearish structure. It is worth noting that BTC has never closed above the 100-day SMA since October 2025. If the price closes above the 100-day SMA at $75,300, it would indicate that the bulls are back in the game.
BTC price will then challenge the 0.5 Fibonacci at $76,662.
DASH Rally Fades 12% But Hints at Selective Strength
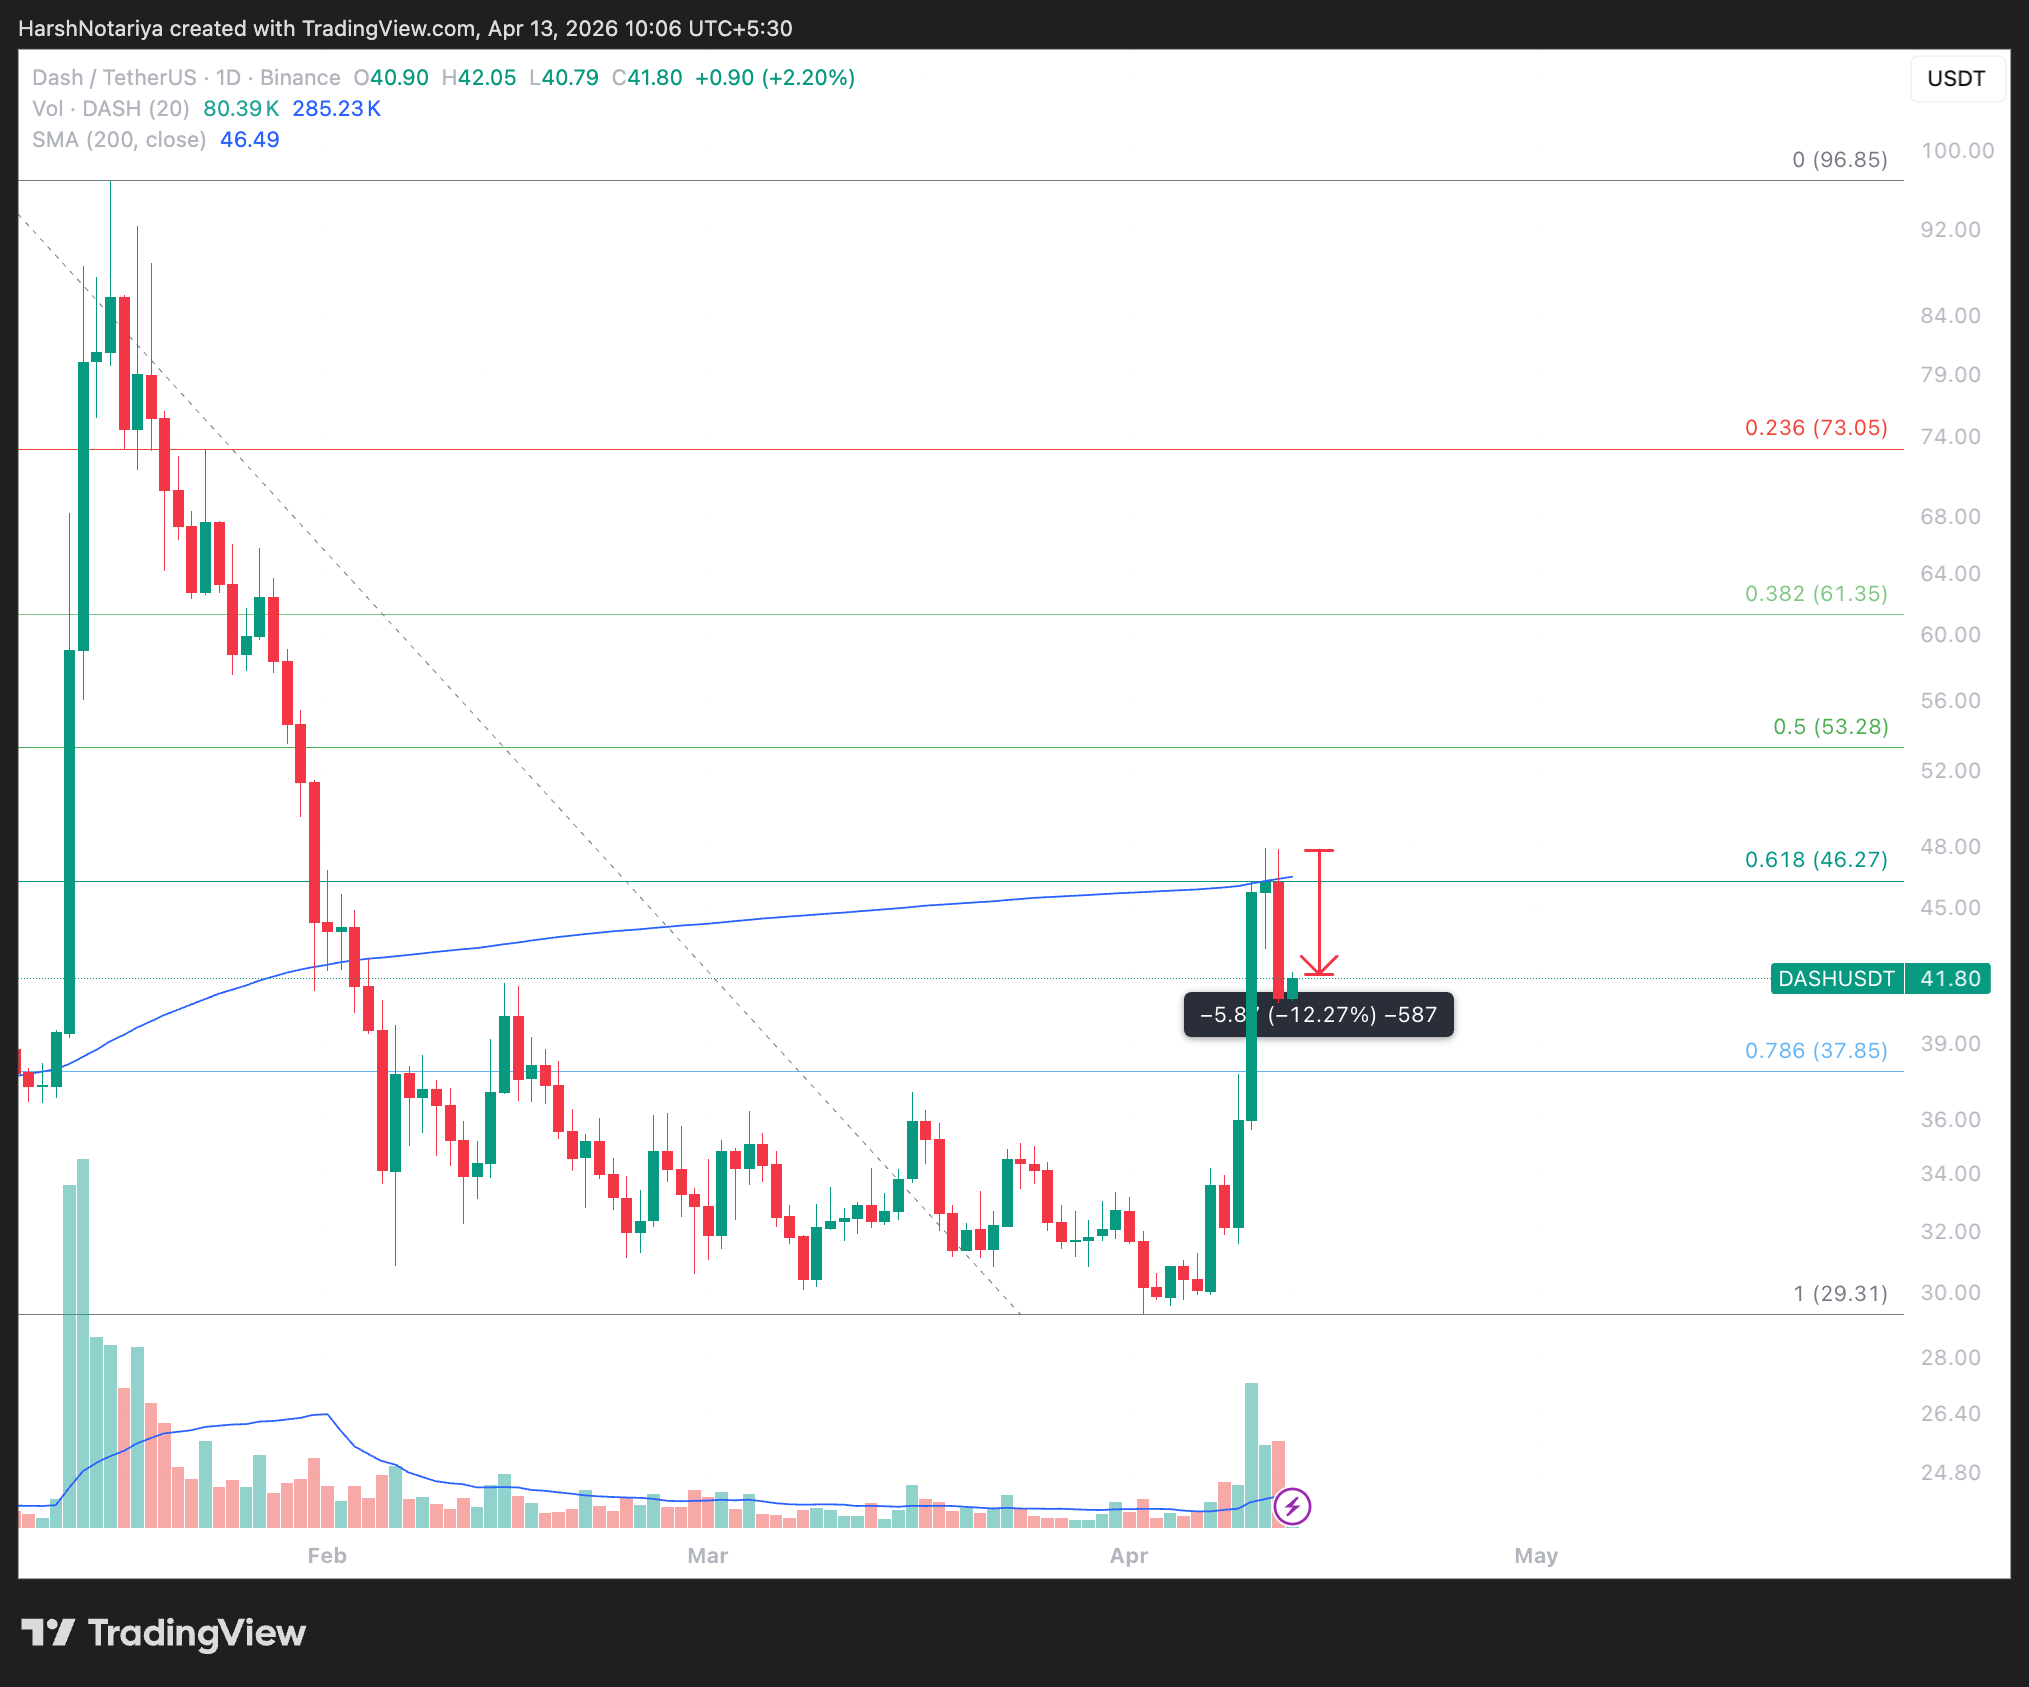
Despite the broader crypto market down trend, DASH offered a contrasting signal. The privacy-focused token surged over 100% in the past week. It climbed from lows near $29 to highs above $47.
However, the rally has since cooled. The daily chart shows a 12.27% correction from the recent swing high. The price pulled back to $41.80 as the 200-day SMA at $46.49 rejected the move higher.
 DASH Price Analysis. Source: TradingView
DASH now trades between the 0.618 Fibonacci level at $46.27 and the 0.786 level at $37.85. The volume spike during the rally suggests genuine buying interest. However, sustaining gains above $46 remains the key test.
A failure to hold $37.85 could reverse the entire move.
0
0


 Manage all your crypto, NFT and DeFi from one place
Securely connect the portfolio you’re using to start.


0
0

0
0
