Pi Network Weekly Losses Reach 15% – What’s Behind the Drop?

0
0

Pi Network (PI) is showing mounting technical weakness, down nearly 15% over the past seven days and 4.4% in the last 24 hours, with its market cap now sitting at $5.12 billion. Trading volume has surged 25% in the past day, reaching $104.6 million, signaling heightened activity amid a deepening downtrend.
Key indicators like the ADX, CMF, and EMA structure all point to growing bearish momentum, with selling pressure intensifying and price action struggling to hold support. Unless momentum shifts, PI appears vulnerable to further downside in the near term.
PI Network’s Bearish Trend Strengthens
The Directional Movement Index (DMI) chart for Pi Network (PI) shows a notable rise in the Average Directional Index (ADX), which has climbed to 21 from 11.46 just a day earlier.
The ADX measures the strength of a trend, regardless of direction. Generally, an ADX below 20 suggests a weak or non-trending market, while readings above 20 indicate that a trend is beginning to gain strength.
With PI’s ADX now breaking above this threshold, the data suggests that a more decisive move—either bullish or bearish—may be developing.
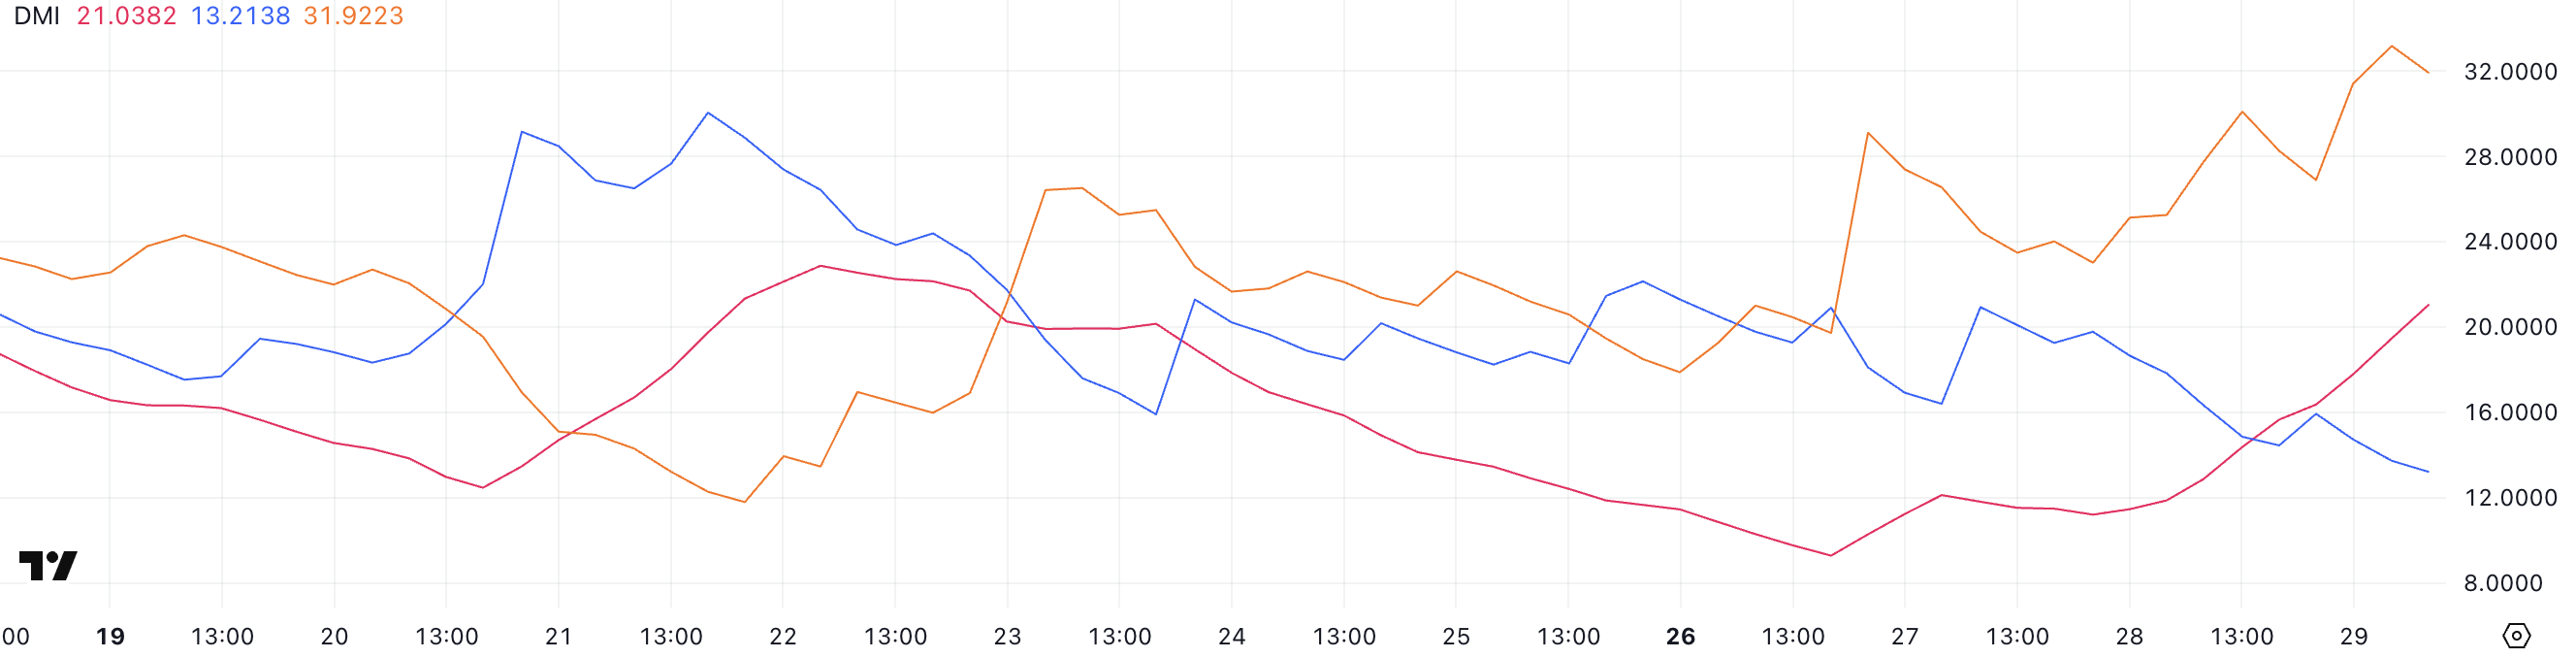 PI DMI. Source: TradingView.
Looking deeper, the +DI (Positive Directional Indicator) has dropped to 13.21 from 20.93 two days ago, while the -DI (Negative Directional Indicator) has surged to 31.92 from 23.48.
This widening gap, with -DI clearly dominant, signals increasing downward pressure on PI. When the -DI rises above the +DI alongside a strengthening ADX, it typically confirms a bearish trend gaining momentum.
In short, the indicators are aligning to suggest PI may be entering a stronger downtrend, and traders should watch closely for follow-through in price action.
Indicators Show Strong Selling Pressure
The Chaikin Money Flow (CMF) for Pi Network (PI) has dropped sharply to -0.20, down from 0.08 three days ago and -0.08 just one day ago.
The CMF is a volume-weighted indicator that measures the flow of money into and out of an asset over a set period, typically 20 or 21 days.
Values above 0 generally indicate buying pressure and accumulation, while values below 0 suggest selling pressure and distribution. A CMF reading beyond ±0.10 is usually considered significant, with deeper negative values pointing to sustained outflows.
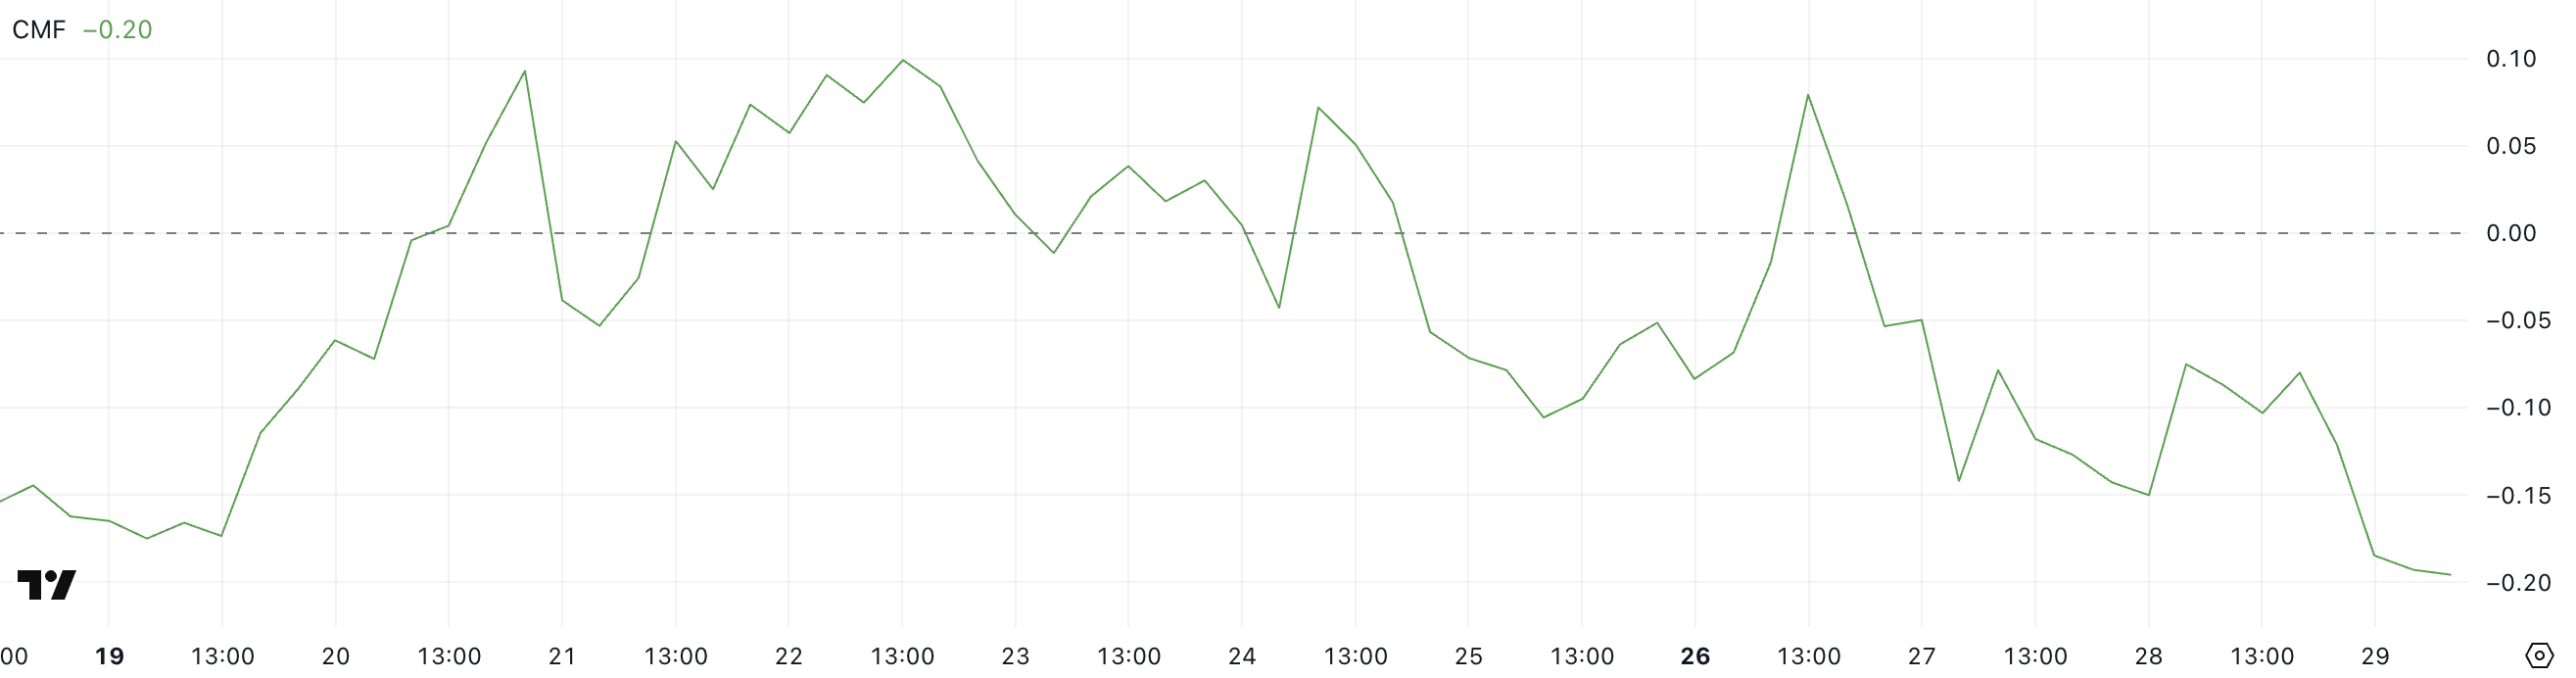 PI CMF. Source: TradingView.
With PI’s CMF now at -0.20—its lowest reading since May 17—there’s a strong signal that sellers are in control.
This steep drop reflects increasing capital leaving the asset, and when combined with recent price weakness, it reinforces a bearish outlook.
If CMF continues to decline or holds at deeply negative levels, it may suggest that any bounce attempts could face heavy resistance due to a lack of bullish volume support.
PI Price Eyes Lower Support
The Exponential Moving Average (EMA) indicators for PI remain bearish, with short-term EMAs positioned below long-term ones—a clear sign that downward momentum is still in control.
The growing distance between these EMA lines reinforces the strength of the current downtrend. If PI continues to slide, the next support level lies at $0.66, and losing that could open the door for a further decline toward $0.57.
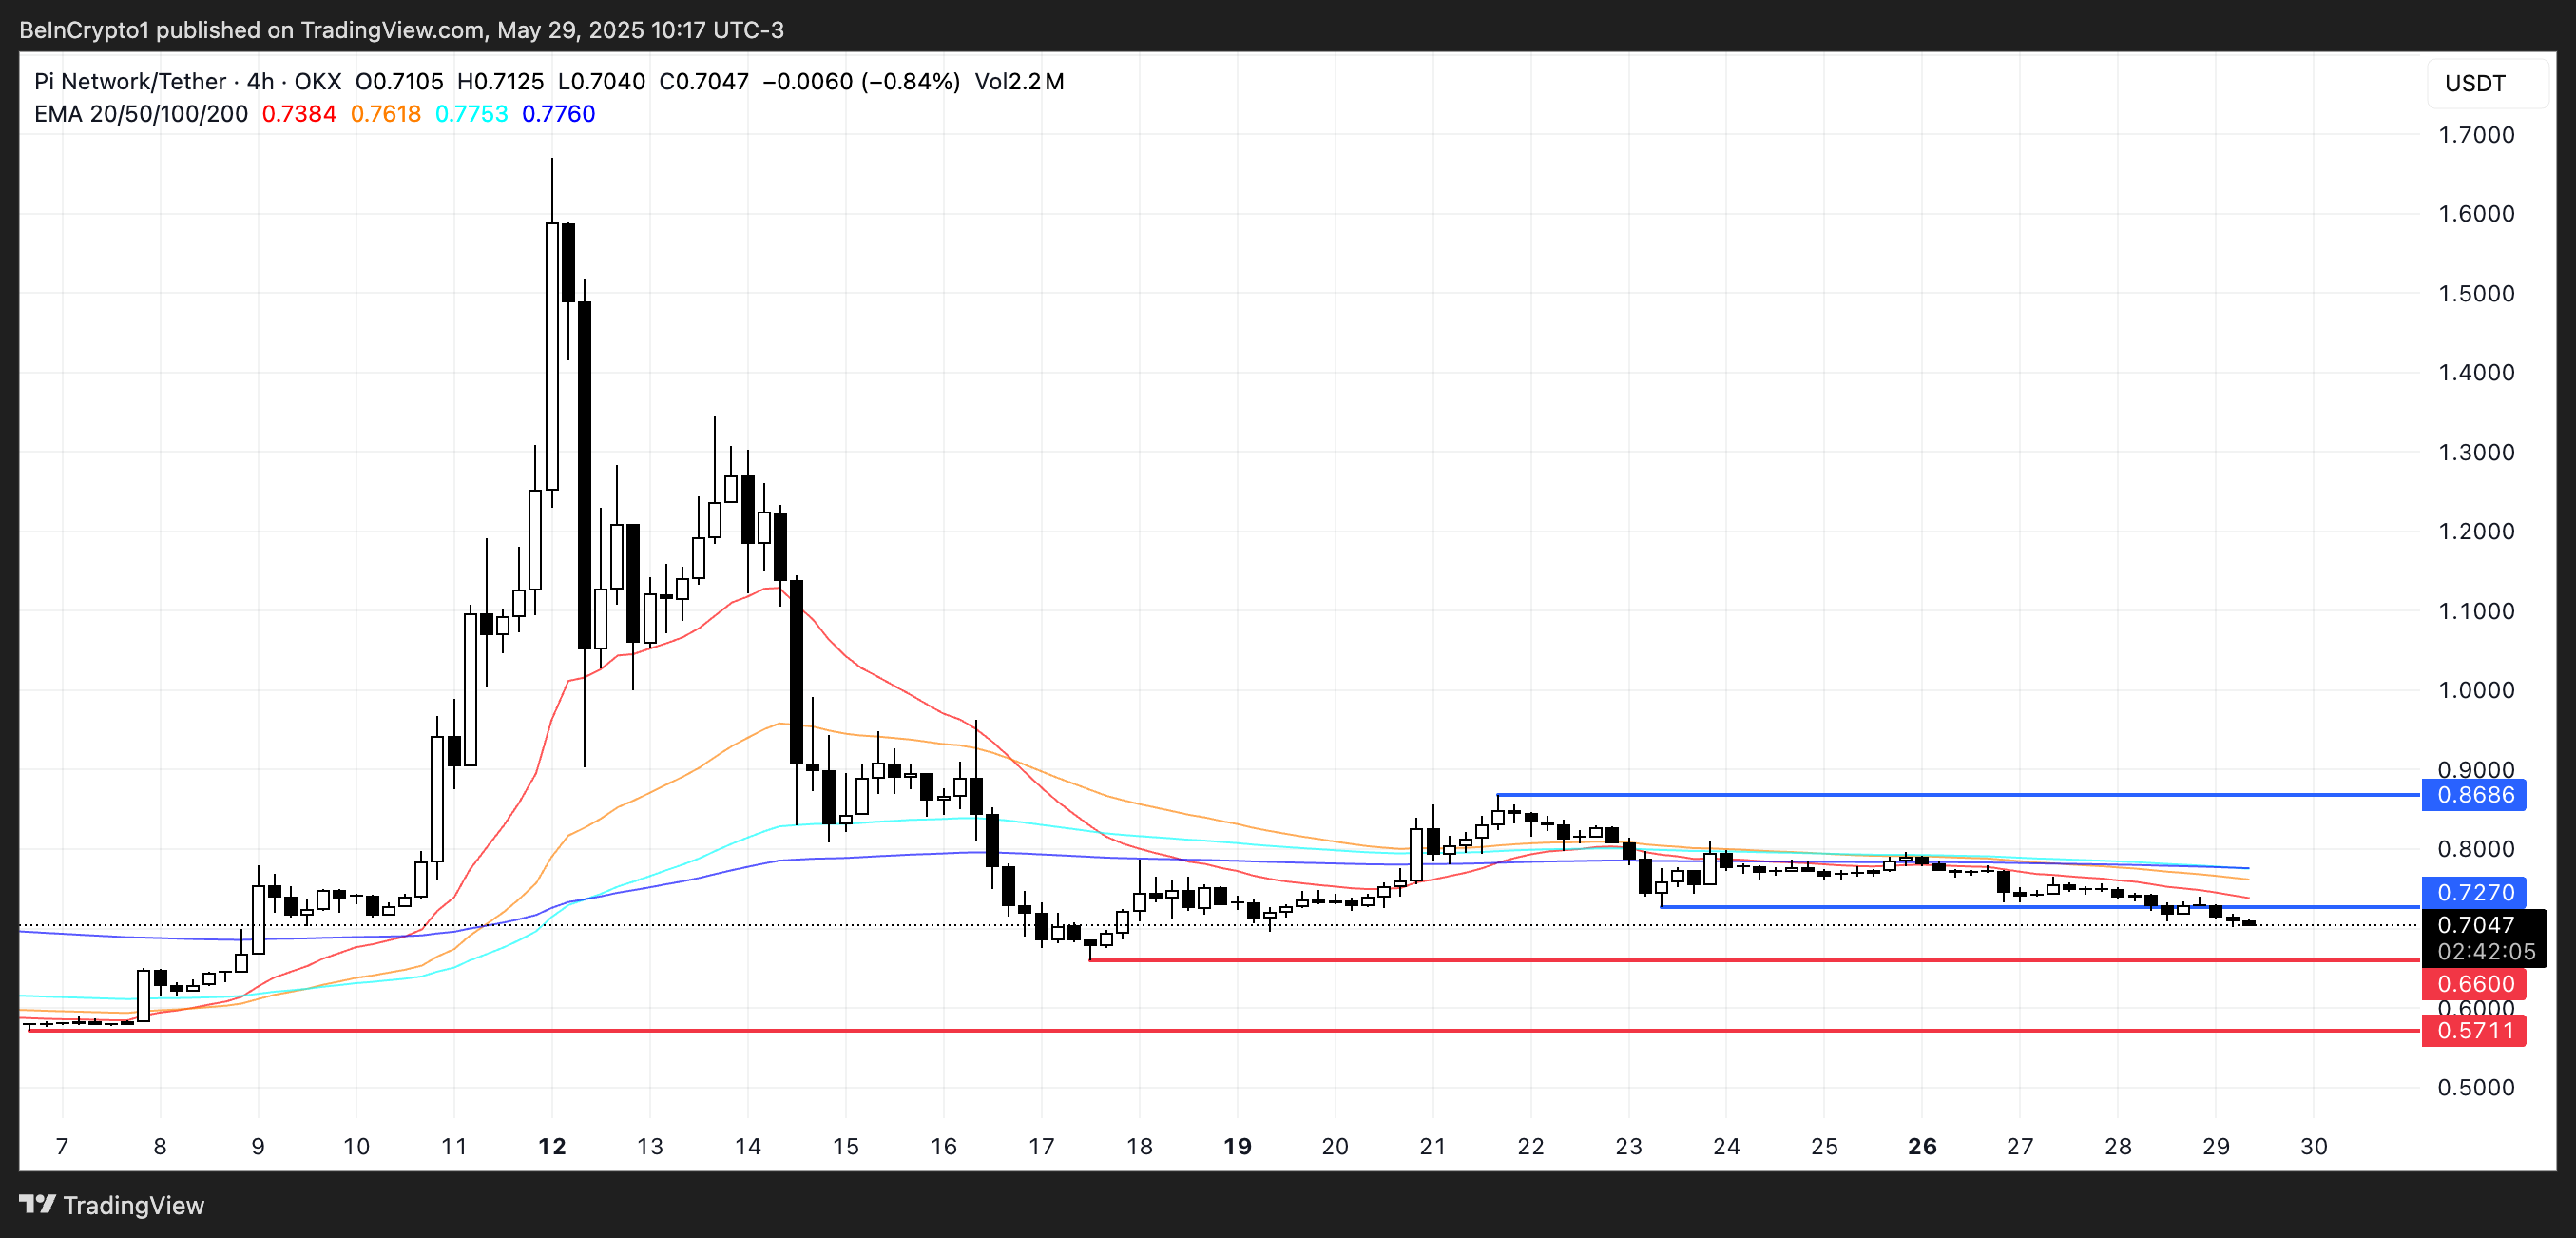 PI Price Analysis. Source: TradingView.
On the flip side, if PI manages to reverse its current trajectory, the first key resistance to watch is at $0.727. A breakout above that level could signal a short-term recovery and potentially send the price higher toward the $0.86 mark.
However, until short-term EMAs start to flatten or cross above the longer-term ones, any bullish attempts may remain vulnerable to selling pressure.
0
0


 Manage all your crypto, NFT and DeFi from one place
Securely connect the portfolio you’re using to start.

0
0


0
0