Bitcoin Cash (BCH) Price Prediction 2025–2029: Will Bitcoin Cash Hit $630 Soon?
0
0

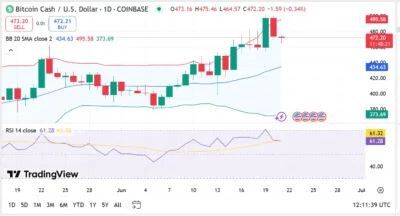
Bitcoin Cash is nearing a critical resistance level after showing consistent strength throughout June. BCH is currently trading at $472.20 after reaching a high of $475.46 during the day. The slight intraday dip of 0.34% reflects some selling pressure, but the broader trend remains upward.
The RSI indicator is at 61.28, which is considered to be a compromise of bullish energy. In the same breath, the upper part of the Bollinger Bands is also being put to the test, and the upper band is set at 495.58. A clear break higher than this point may open the way to the price milestone of $500, which is of great psychological and technical importance.
Bitcoin Cash is an invention focusing on addressing issues related to Bitcoin’s scalability. A group of Bitcoin developers opposed the Segregated Witness (SegWit) because they claimed it was undermining decentralization.
Instead, this group advocated further raising the maximum block size, resulting in the forking of Bitcoin Cash in 2017, with the maximum block size at 8MB, which was subsequently increased by 32 MB.
Further splits followed in November 2018 when the network was divided again into Bitcoin Cash and Bitcoin SV, the latter championing even larger blocks of up to 128MB. In November 2020, another fork was created, Bitcoin Cash ABC (BCHA), which imposed a tax of 8 percent on the miners to pay for their development.
With these divisions, however, Bitcoin Cash has been adhering to its definition as a peer-to-peer digital currency. It is different when it concerns faster transactions, low transaction fees, and using an on-chain scaling model rather than layering.
Technical Outlook
Bollinger Bands Analysis
BCH is available near the upper Bollinger Band at 495.58, which means the current rally can soon reach the top. The middle band, which shows the position of the 20-day SMA, is at $434.63 and still provides good support for the bullish trend.
The lower Bollinger Band rests at the value of 373.69 because this value can become an area of strong demand in case of price retracement. Through the month of June, price compression was critical in building the foundation of the existing pattern of breakout.
RSI Analysis
Relative Strength Index at 61.28 indicates that it is still in bullish moods and is not in overbought territory. Subsequently, a surge over 65 could prove breakout momentum, provided that the price can close above 480 in the short term.
Nonetheless, since below 60 is a potential signal of a slowdown in buying interest, it positions it set to a likely consolidation period.

Source: Tradingview
Bitcoin Cash (BCH) Price Prediction Table (2025–2029)
| Year | Minimum Price | Average Price | Maximum Price |
| 2025 | $410.00 | $475.00 | $515.00 |
| 2026 | $430.00 | $510.00 | $580.00 |
| 2027 | $470.00 | $545.00 | $630.00 |
| 2028 | $500.00 | $590.00 | $690.00 |
| 2029 | $550.00 | $640.00 | $750.00 |
Yearly Price Breakdown
2025
This year, the BCH average could be $475.00, with the price potentially testing $515.00 if the broader market sentiment supports further gains.
2026
Network growth and consistent utility as a payment token may drive prices toward a peak of $580.00, with a support base of around $430.00.
2027
Adoption of BCH for low-fee transactions could sustain a yearly average of $545.00, with a high at $630.00, depending on user activity and integrations.
2028
Wider use in merchant payments and remittances may push BCH toward $690.00, while $500.00 remains a likely support zone.
2029
With increased institutional exploration of scalable blockchain payment systems, BCH may touch $750.00, ending the year with an average of around $640.00.
Conclusion
After weeks of upward price action, Bitcoin Cash is approaching a crucial resistance level just below $500. While short-term indicators suggest mild overheating, BCH continues to benefit from a strong historical foundation and a clear vision for scalability. With a defined niche in low-fee, high-volume transactions and a history of protocol independence, Bitcoin Cash may be well-positioned for steady gains over the next four years.
FAQs
1. What is Bitcoin Cash currently trading at?
Bitcoin Cash is trading at $472.20, reflecting a slight dip of 0.34% in the latest session.
2. Why was Bitcoin Cash created?
It was created to improve transaction capacity by increasing block sizes, in opposition to Bitcoin’s SegWit solution.
3. What does the RSI currently indicate?
The RSI at 61.28 shows moderate bullish momentum, with potential room for upside.
4. What are the current support and resistance levels?
Support lies near $434.63, while the upper Bollinger Band at $495.58 serves as immediate resistance.
5. Can Bitcoin Cash reach $750 by 2029?
If current adoption trends continue and market sentiment strengthens, BCH could reach $750 over the long term.
Also Read: Texas Enacts HB4488 to Shield Bitcoin Reserve and State Funds From General Revenue Access
The post Bitcoin Cash (BCH) Price Prediction 2025–2029: Will Bitcoin Cash Hit $630 Soon? appeared first on 36Crypto.
0
0
 Manage all your crypto, NFT and DeFi from one place
Securely connect the portfolio you’re using to start.


