
USD.AI crypto: CHIP holds bullish hourly trend, but $0.04 resistance looms

0
0

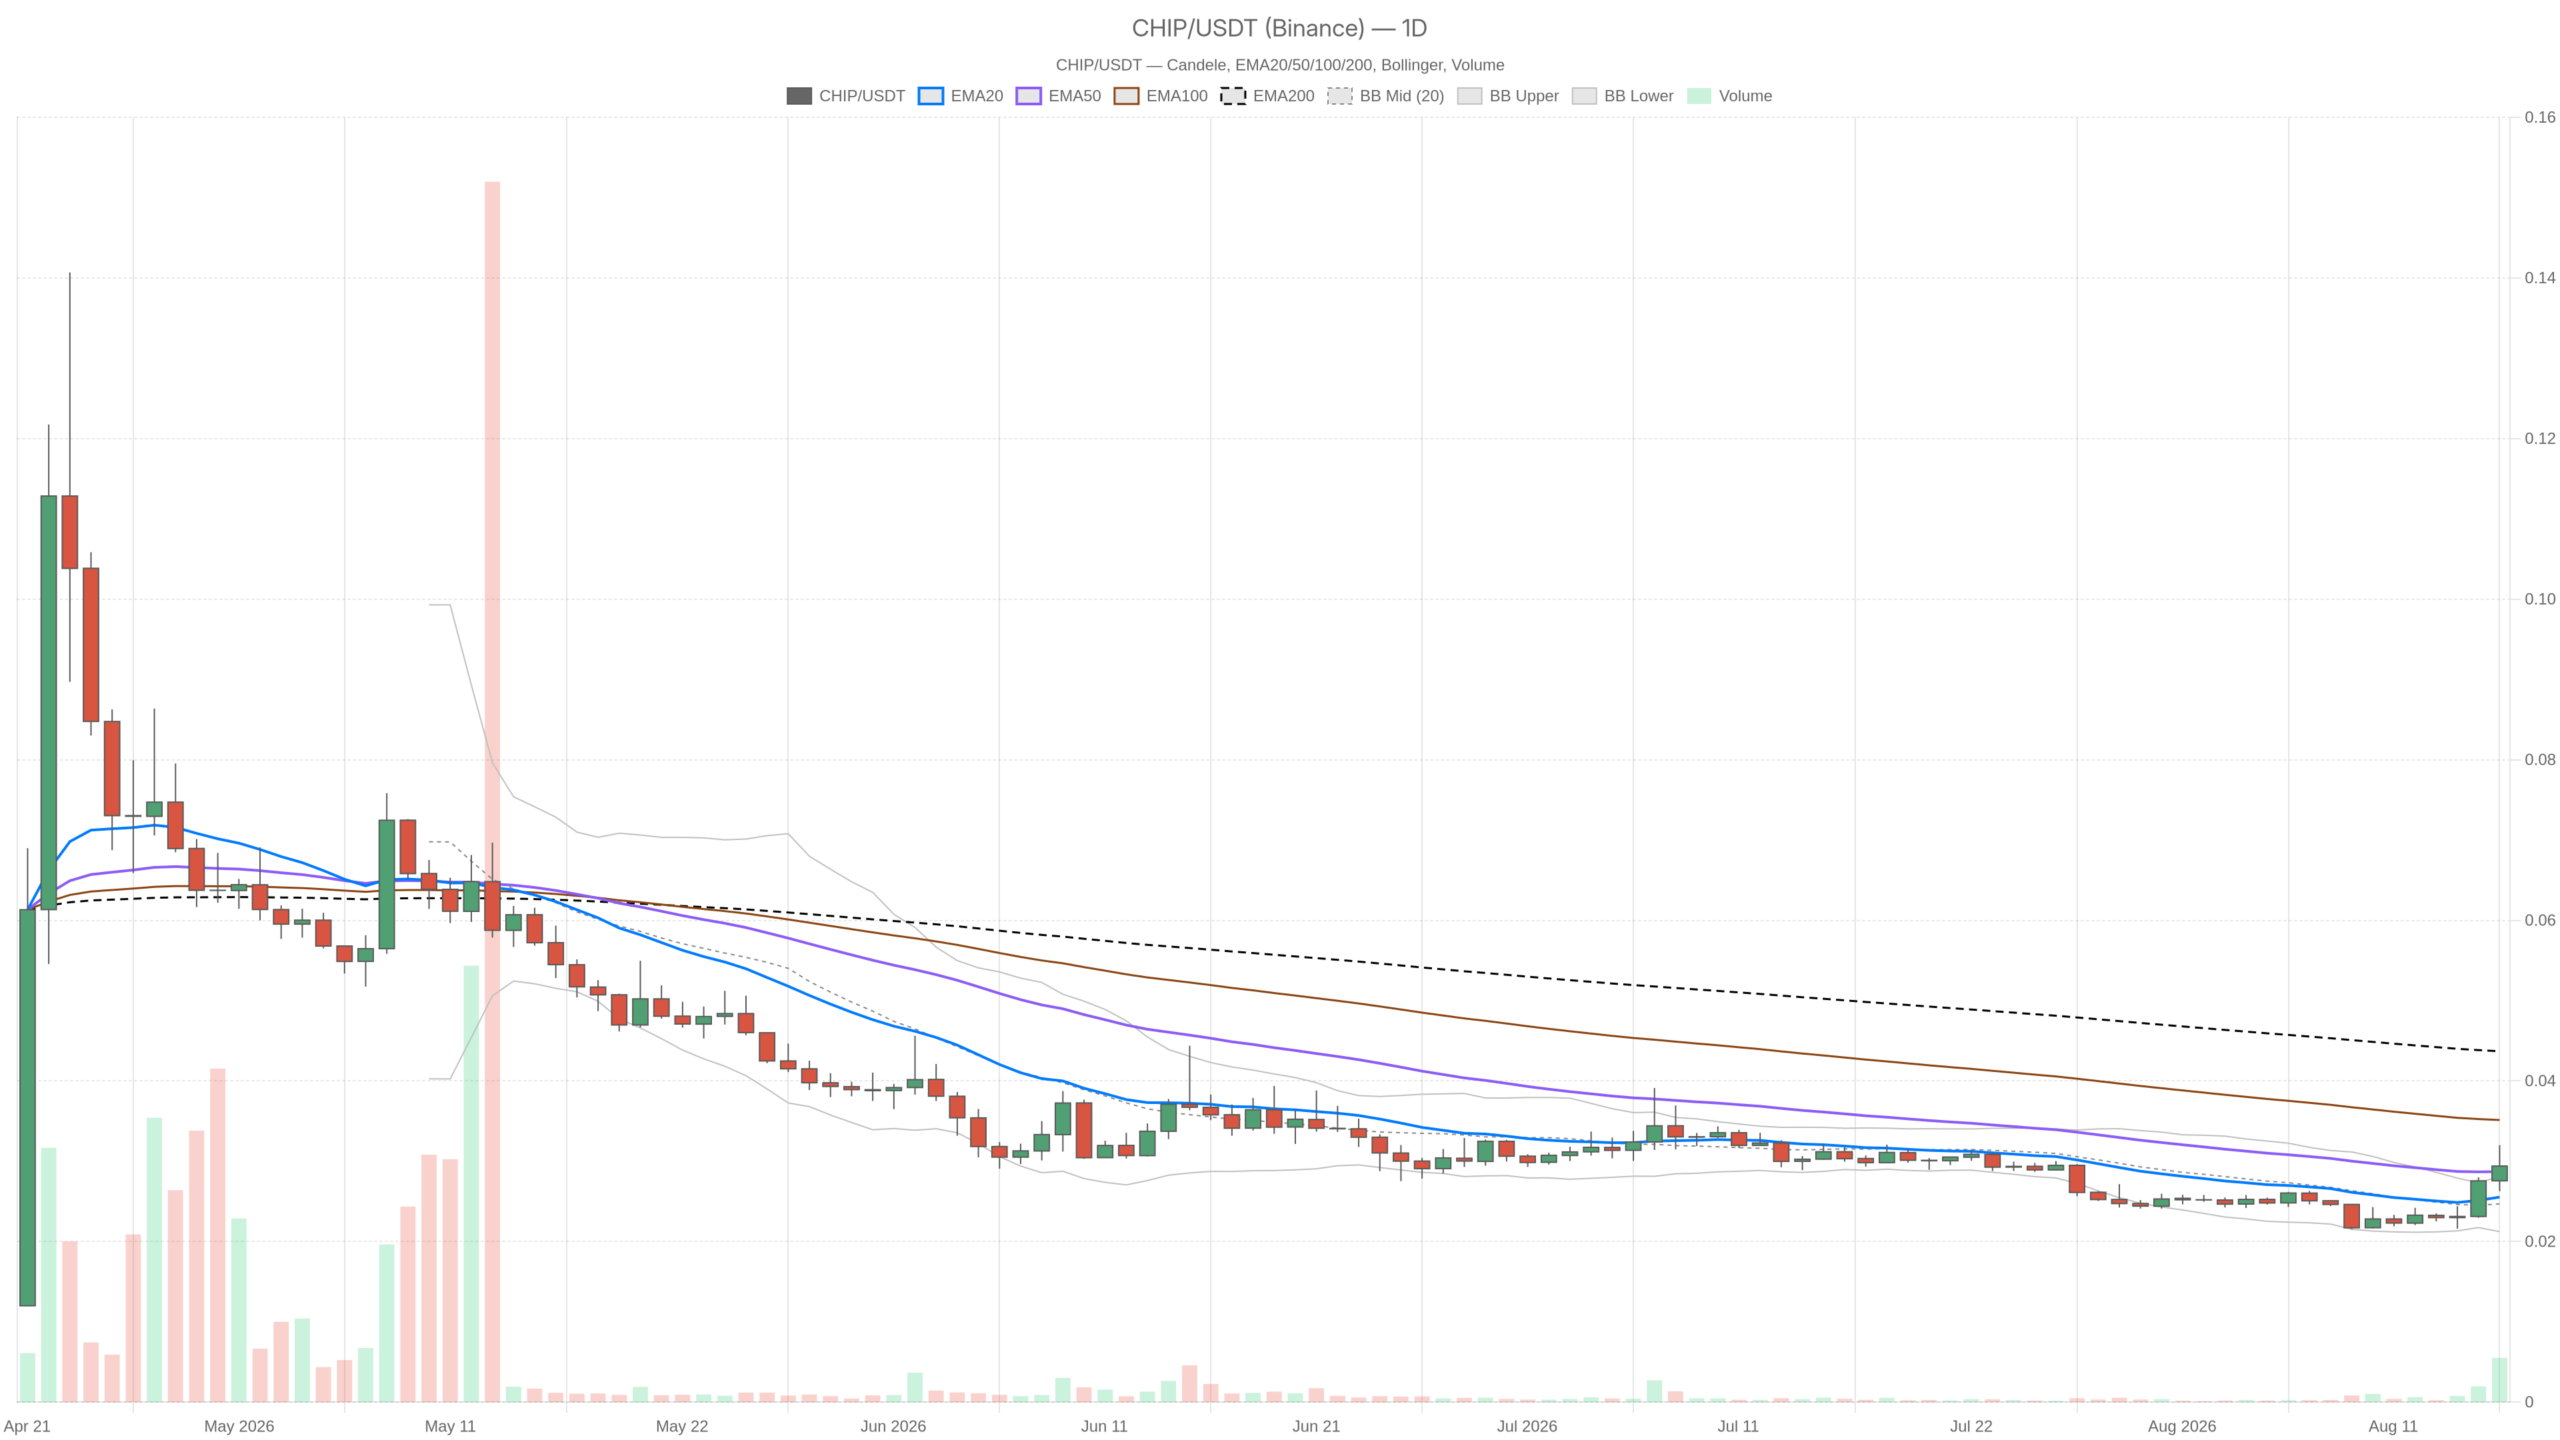
As of August 16, 2026, CHIP — the ticker for USD.AI crypto — sits at $0.03 against USDT, caught between a daily chart that remains unresolved and an hourly structure that is leaning clearly bullish. That gap between timeframes is the whole story right now.
Key takeaways
- CHIP trades at $0.03, remaining below the daily EMA200 at $0.04 despite a constructive short-term structure.
- RSI momentum is fading across timeframes: daily at 61.11, hourly at 59.84, and 15-minute at 58.05.
- Pivot support and resistance levels cluster tightly around $0.03, signaling compressed volatility ahead of a potential breakout.
- The Fear & Greed Index reads 34 with Bitcoin dominance at 56.14%, indicating defensive capital positioning across the market.
- A daily close above the EMA200 at $0.04 would flip the macro bias bullish; a slide below the hourly EMA200 at $0.02 would invalidate the bounce.
Daily Bias: Neutral With Unfinished Business Below EMA200
The daily chart remains neutral because price at $0.03 sits below the EMA200 at $0.04, even though short-term averages have now converged. Price is sandwiched right at the EMA20 and EMA50, both at $0.03, but the long-term average has not been reclaimed. Until that gap closes, calling this an established uptrend would be premature.
RSI14 on the daily sits at 61.11 — firmly in bullish territory but nowhere near overbought. That is a healthy reading if you are looking for room to run, though it does not scream momentum either. MACD is flat at zero across line, signal, and histogram, which is essentially the indicator shrugging. When RSI is constructive but MACD stays silent, the move is still building rather than accelerating.
The Bollinger Bands reinforce this picture: the mid-band sits at $0.02, the upper at $0.03, and the lower at $0.02. Price is riding the upper band, and in a low-volatility context, that usually means the recent push has already consumed a good portion of its short-term energy. It is not a reversal signal by itself, but it suggests the easiest part of the move may be behind it.
1H Confirmation: Bullish Structure With Cooling Momentum
The hourly chart confirms a bullish EMA alignment: price at $0.03 trades above both the EMA20 and EMA50 at $0.03, and well clear of the EMA200 at $0.02. Buyers have controlled the tape on this timeframe, and that short-term structure is genuinely constructive. However, RSI14 on the 1H comes in at 59.84, still healthy but noticeably lower than the daily reading of 61.11.
That small step down is a real deceleration signal worth paying attention to. MACD here is also flat at zero, mirroring the daily story — price is moving, but the trend-following indicator has not yet confirmed the direction. The bullish label on this timeframe is earned mechanically by the EMA alignment, yet the RSI cooling suggests the push higher is losing steam rather than gaining it.
15-Minute Execution Context
Dropping to the 15-minute chart, the regime stays bullish with RSI14 at 58.05 — again lower than the hourly reading above it. The pattern is consistent across all three timeframes: RSI steps down from daily (61.11) to hourly (59.84) to 15-minute (58.05). None of these readings are bearish on their own, but the direction of travel says momentum is fading. For anyone using this timeframe for entries, that signals more selectivity about chasing strength.
Pivot Levels and the Reality of a Tight Range
The daily pivot point, R1, and S1 all cluster around $0.03, meaning CHIP is trading essentially on top of its own pivot — there is very little room between support and resistance in absolute terms. That kind of compression often precedes a directional move once volume picks up, but right now it reflects indecision more than an imminent breakout. Volatility readings on this pair are compressed across the board.
Bullish and Bearish Scenarios
The bullish case for USD.AI crypto hinges on price holding above the daily EMA20/EMA50 cluster near $0.03 and eventually closing the gap toward the EMA200 at $0.04. For that to happen credibly, RSI would need to stay above the 55–60 zone across timeframes rather than continuing to slip, and MACD would need to turn positive instead of sitting flat. A push through the upper Bollinger Band with follow-through volume would be the confirmation bulls want to see.
What invalidates the bullish view: a slide back below the hourly EMA200 at $0.02, or a daily close back under pivot support — either would suggest the bounce was noise inside a still-unresolved downtrend. The bearish case, meanwhile, leans on the fact that daily price remains below EMA200 and that RSI momentum is cooling on shorter timeframes. If CHIP fails at the upper Bollinger Band and pivot resistance around $0.03, a reversion toward the mid-band near $0.02 becomes the more likely outcome.
What would invalidate the bearish perspective: a daily close back above the EMA200 at $0.04 with RSI pushing convincingly past 65–70 and the MACD histogram turning positive. That combination would flip the macro bias in the bulls’ favor and signal a genuine trend change rather than a temporary bounce.
The Bigger Market Backdrop
Context matters here. The Fear & Greed Index reads 34, in Fear territory, while Bitcoin dominance sits at 56.14% according to aggregated market data. That combination usually means capital is staying defensive and concentrated rather than rotating aggressively into altcoins. Total crypto market cap is essentially flat over 24 hours, down just -0.0047%, so this is not a market in a clear risk-on or risk-off stampede — it is more of a stalemate.
On-chain activity data adds another layer: DefiLlama figures show major DEXs like Uniswap V3 and Curve posting sharp daily fee declines — Uniswap V3 down 66.15% and Curve down 65.43%. That points to a broader pullback in DeFi trading activity right now. It is worth flagging for anyone framing CHIP’s bounce as the start of a new altcoin leg, because the underlying plumbing of DeFi is not exactly buzzing with fresh risk appetite at the moment.
There is also a wider narrative in play: reporting from Bloomberg and the Financial Times this month has centered on massive AI infrastructure spending, including Nvidia’s reported $500 billion plan drawing Wall Street deeper into the AI trade, alongside China’s push to compete on AI and chip dominance. That is an equities and infrastructure story first, but it is the kind of macro AI enthusiasm that keeps AI-adjacent crypto assets like CHIP on traders’ radars even when the broader crypto Fear & Greed reading is soft.
Where This Leaves Traders
What CHIP presents right now is a short-term bullish structure trying to assert itself inside a daily chart that has not confirmed the move. That is not a reason to dismiss the bounce, but it is a reason to treat it with caution — RSI cooling as you move down through the timeframes is a real tell, not noise. Position sizing and clear invalidation levels matter more than usual in a setup where the daily and hourly stories are not yet telling the same tale.
FAQ
What is the current price of CHIP?
As of August 16, 2026, CHIP is trading at $0.03 against USDT, with the daily close remaining below the 200-period EMA at $0.04.
Is the short-term trend for CHIP bullish or bearish?
The hourly chart shows a bullish structure, with price trading above the EMA20, EMA50, and EMA200. However, RSI momentum is cooling across timeframes, from 61.11 on the daily down to 58.05 on the 15-minute chart, suggesting the push higher is losing steam rather than accelerating.
What are the key levels to watch for CHIP?
The critical resistance is the daily EMA200 at $0.04 — a close above it with rising RSI and positive MACD would confirm a trend change. On the downside, a break below the hourly EMA200 at $0.02 would invalidate the current bullish structure.
How is the broader market affecting CHIP?
The Fear & Greed Index at 34 and Bitcoin dominance at 56.14% indicate defensive positioning, while declining DEX volumes on platforms like Uniswap V3 and Curve suggest limited risk appetite for altcoins at this time.
Disclaimer: This article is for informational purposes only and does not constitute financial advice, an investment recommendation, or a solicitation to buy or sell any financial instrument or cryptocurrency. The analysis provided is not indicative of future results. Investing in crypto assets and financial markets carries a high risk of capital loss. Always do your own research (DYOR) and consult a qualified financial advisor before making any decision.
Article produced with the assistance of artificial intelligence and reviewed by the editorial team.
0
0

 Manage all your crypto, NFT and DeFi from one place
Securely connect the portfolio you’re using to start.


