ADA slips under $0.24 as bearish momentum signals more losses

0
0

The cryptocurrency market opened the new weekly candle bearish as Bitcoin and other leading coins underperformed over the past 24 hours.
Bitcoin is trading below $71,000 on Monday after Trump announced that he ordered the naval blockade of the Strait of Hormuz on Sunday.
With Bitcoin in the red, other leading altcoins, including Cardano (ADA), are also underperforming.
ADA is down by 1.5% and trading below $0.2400.
Mixed signals with a slight bearish bias from the derivatives market, coupled with weakening momentum indicators, suggest a possibility of deeper losses in ADA this week.
ADA stays below $0.2400 amid weak derivatives data
Cardano lost its position in the top 10 earlier this month and has failed to recover since then.
The coin lost 5.5% of its value last week and has now opened the new weekly candle bearish.
The poor performance comes as Cardano’s derivatives data show mixed signals with a slight bearish tilt.
According to CoinGlass, Cardano’s long-to-short ratio reads 1.05 on Monday.
The being above one reflects bullish sentiment in the market, as more traders are betting on the asset’s price to rally.
However, the funding rates and the Open Interest (OI) data support a bearish thesis.
CoinGlass’ OI-Weighted Funding Rate data for Cardano flipped negative on Sunday and reads -0.0093% on Monday, indicating that shorts are paying the longs and projecting a bearish outlook.
Furthermore, ADA’s OI has been declining since mid-January and reads [MONEY value="432420000" currency="usd" notation="long" replace="false"] on Monday, indicating fading investor participation.
The combination indicates indecision among investors, with the bears currently taking charge of the market.
Cardano price forecast
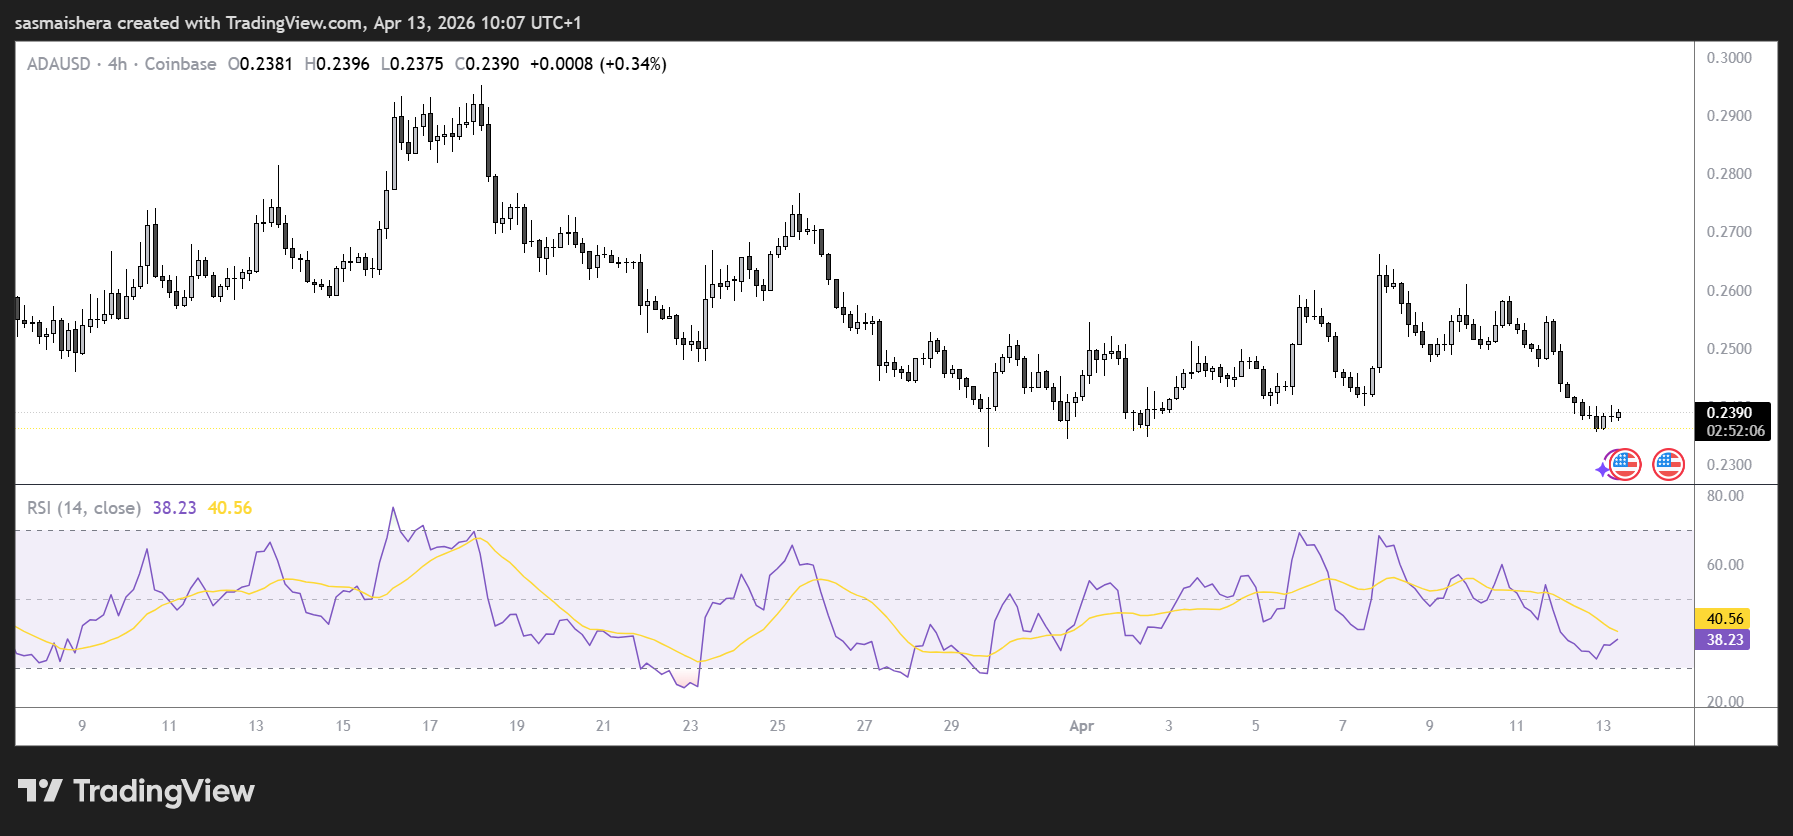
The ADA/USD 4-hour chart is one of the most bearish among the leading cryptocurrencies by market cap.
At press time, ADA is trading at $0.2387 and could dip lower in the near term, as per data from various crypto trading apps.
It is currently trading below the 50-day, 100-day, and 200-day Exponential Moving Averages (EMAs), which stack overhead as dynamic resistance.
The momentum indicators also show a bearish setup.
The Relative Strength Index (RSI) on the 4-hour chart around 40 stays in weak territory, while the Moving Average Convergence Divergence (MACD) has slipped marginally below zero.
The two indicators suggest that downside pressure persists even as immediate selling momentum is not extreme.
If the bulls regain control, ADA may face immediate resistance at the $0.2450 zone, ahead of the 50-day EMA around $0.264 and the 23.6% Fibonacci retracements at roughly $0.2690.
A daily candle close above these levels could see ADA target the 100-day EMA near $0.3050, and the 200-day EMA around $0.3990.
However, if the bears continue to be in control, ADA may lose the immediate support level at $0.2329, with the next major support emerging around $0.2200.
The post ADA slips under $0.24 as bearish momentum signals more losses appeared first on Invezz
0
0


 Manage all your crypto, NFT and DeFi from one place
Securely connect the portfolio you’re using to start.


0
0


0
0