Can Chainlink Overcome Its $23 Ceiling? Analysts Predict $27 Next
0
0

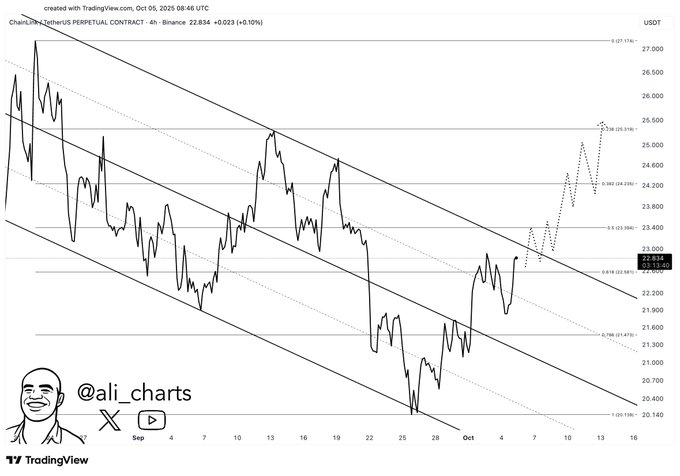
Chainlink price is back in the spotlight as the decentralized oracle network approaches a crucial resistance zone around $23. Market participants are closely watching this level, which has repeatedly acted as a barrier for LINK in past rallies.
If Chainlink price manages to break above this range, analysts believe it could trigger a fresh bullish wave targeting $27 in the short term.
Chainlink Price Gains Momentum as It Nears $23 Resistance
LINK price has been trending higher towards $23, with solid technicals and ceding little to short-term fluctuations. The token now trades at about $22.17, a decrease of 2.87% in the past 24 hours and with a market cap of around $15.03 billion.
Volumes have swelled, implying increased interest among retail as well as institutional investors. This spike in trading activity is being interpreted as a precursor to an impending Chainlink price breakout by some analysts.
Chainlink (LINK) is a decentralized oracle network that connects smart contracts with data from the real world. It has become one of the most reliable infrastructures in the decentralized finance (DeFi) sector over the years.
Also Read: How Chainlink and SWIFT Integration Could Bring Tokenized Funds Onchain
The recent panic around Chainlink has seen market sentiment and technical factors moving in tandem. The $23 area has previously been resistance and, therefore, also holds psychological significance for traders who are accustomed to seeing prior rallies climax around this level.
Following a successful break of this level and a close above the 26-hour EMA, analysts believe that LINK will rapidly move to $27. But a rejection at $23 could result in more consolidation near the $20–$22 area, before a new uptrend could begin.

Strength at the $23 Resistance
The $23 level has become a technical battlefield. Historically, Chainlink has faced selling pressure every time it approached this point. Yet, this time, momentum indicators such as the Relative Strength Index (RSI) and Moving Average Convergence Divergence (MACD) are leaning slightly bullish.
These technical setups suggest that buying strength may finally be sufficient to overcome the ceiling. Traders are also pointing to a rise in open interest across futures markets, indicating that speculative positions are growing.
Technical Patterns and Market Signals
Chainlink has been forming higher lows, a classic sign of an emerging uptrend. Analysts note that this pattern reflects strengthening demand each time LINK dips. Technical formations also reveal a narrowing price range, often a precursor to a significant move.
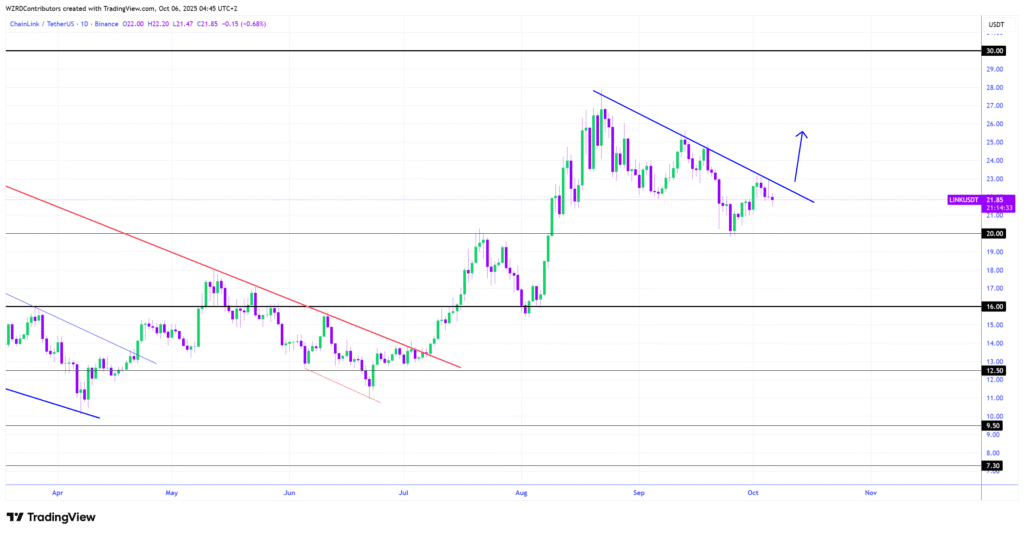
However, caution remains. A recent gravestone doji on the daily chart suggests potential short-term weakness. Market analyst CRYPTOWZRD commented that while a minor pullback is possible, the overall structure still favors a bullish recovery on the LINK/BTC pair.
According to his view, a confirmed breakout above $22.50 could open the path toward $24 and later $27.

Bitcoin’s Dominance Still a Factor
Chainlink price movement is also affected by Bitcoin’s overall dominance in the crypto market. When Bitcoin gains strength, altcoins like LINK often see their momentum slow. Over the past week, Bitcoin’s dominance increased slightly, causing LINK/BTC to close in a neutral to bearish formation.
Analysts believe that a decline in Bitcoin dominance could allow Chainlink to rebound more decisively. If Bitcoin consolidates or experiences mild retracement, liquidity could shift toward altcoins, giving LINK the space it needs to rally.
Market Sentiment and Broader Outlook
The general crypto market sentiment appears to be improving. Several altcoins have begun regaining attention as investors diversify beyond Bitcoin. Chainlink price benefits from this trend, as confidence in decentralized infrastructure projects remains strong.
| Month | Min. Price | Avg. Price | Max. Price | Potential ROI |
|---|---|---|---|---|
| Oct 2025 | $ 21.53 | $ 22.21 | $ 24.20 |
8.93%
|
| Nov 2025 | $ 24.54 | $ 25.96 | $ 27.34 |
23.08%
|
| Dec 2025 | $ 25.51 | $ 26.64 | $ 29.13 |
31.11%
|
Additionally, on-chain data shows that long-term holders continue to accumulate LINK, hinting that investors see value in the token’s long-term utility. This accumulation trend supports a bullish thesis that Chainlink price could continue climbing once resistance breaks.
Potential Scenarios for LINK
If Chainlink breaks the $23 barrier with high trading volume, it may quickly head toward the next major target at $27. The subsequent zone to watch would be around $30, which represents a longer-term resistance level.
On the downside, analysts identify $20 as a solid support area. This range has consistently cushioned LINK during market dips, making it a key level to maintain the current uptrend.
Conclusion
Chainlink nears a crucial point. A successful break above $23 might push the market sentiment in favor of the bulls and they are likely to make a strong move towards $27 or even higher. Increasing volume of trading, higher lows and increasing market sentiment are helping LINK rise.
However, traders should be on the lookout, as there are likely to be spikes in volatility near resistance regions. In other words, Chainlink is at a point of inflection — an upside break could determine the next major trend in weeks.
Also Read: Chainlink Triangle Setup Points to a Breakout Toward $100
Summary
Chainlink is approaching a critical resistance level at $23, which will attract significant attention from traders expecting a potential breakout. The slow uptrend of the token, higher lows and increased volume suggests a momentum increase.
Analysts are also noting that a decisive break above $23 could lift LINK towards $27 – or even as high as $30. But, a rejection could see short term consolidation around $20–$22 price point making the next few sessions critical for LINK.
Appendix: Key Terms Glossary
Resistance Level: A price point where an asset historically faces selling pressure.
Support Zone: A price area where buying interest typically prevents further decline.
Bullish Momentum: A market trend indicating rising prices and investor optimism.
Gravestone Doji: A candlestick pattern signaling potential short-term weakness.
Bitcoin Dominance: The percentage of total crypto market value held by Bitcoin.
Trading Volume: The total number of tokens traded in a specific period, reflecting market activity.
Frequently Asked Questions About Chainlink Price
1- Why is the $23 level important for Chainlink price?
The $23 mark is a key resistance area where previous rallies have failed. A breakout here could confirm renewed bullish momentum.
2- What factors are supporting Chainlink price growth?
Rising volume, positive technical patterns, and improving market sentiment are boosting LINK’s chances of breaking higher.
3- Could Chainlink price face short-term correction?
Yes. The gravestone doji on the daily chart signals possible near-term weakness, though the long-term trend remains optimistic.
4- What is the next target after $23?
If Chainlink price breaks above $23 with conviction, analysts expect a move toward $27 and possibly $30.
Read More: Can Chainlink Overcome Its $23 Ceiling? Analysts Predict $27 Next">Can Chainlink Overcome Its $23 Ceiling? Analysts Predict $27 Next
0
0
 Manage all your crypto, NFT and DeFi from one place
Securely connect the portfolio you’re using to start.


