Ethereum Exchange Holdings Hit 9-Year Low as $5,000 Breakout Looms

0
0

Ethereum (ETH) closed August on a strong note, gaining more than 23% during the 31-day period.
The leading altcoin now appears poised to extend its rally into September, with on-chain data showing a decline in selloffs and a surge in market confidence about its near-term performance.
Ethereum Exchange Balances Crash to 2016 Levels
According to Glassnode, the total amount of ETH held on exchange addresses has dropped to its lowest level since 2016. As of this writing, 16 million ETH valued at around $70.37 billion are held on exchange wallet addresses.
For token TA and market updates: Want more token insights like this? Sign up for Editor Harsh Notariya’s Daily Crypto Newsletter here.
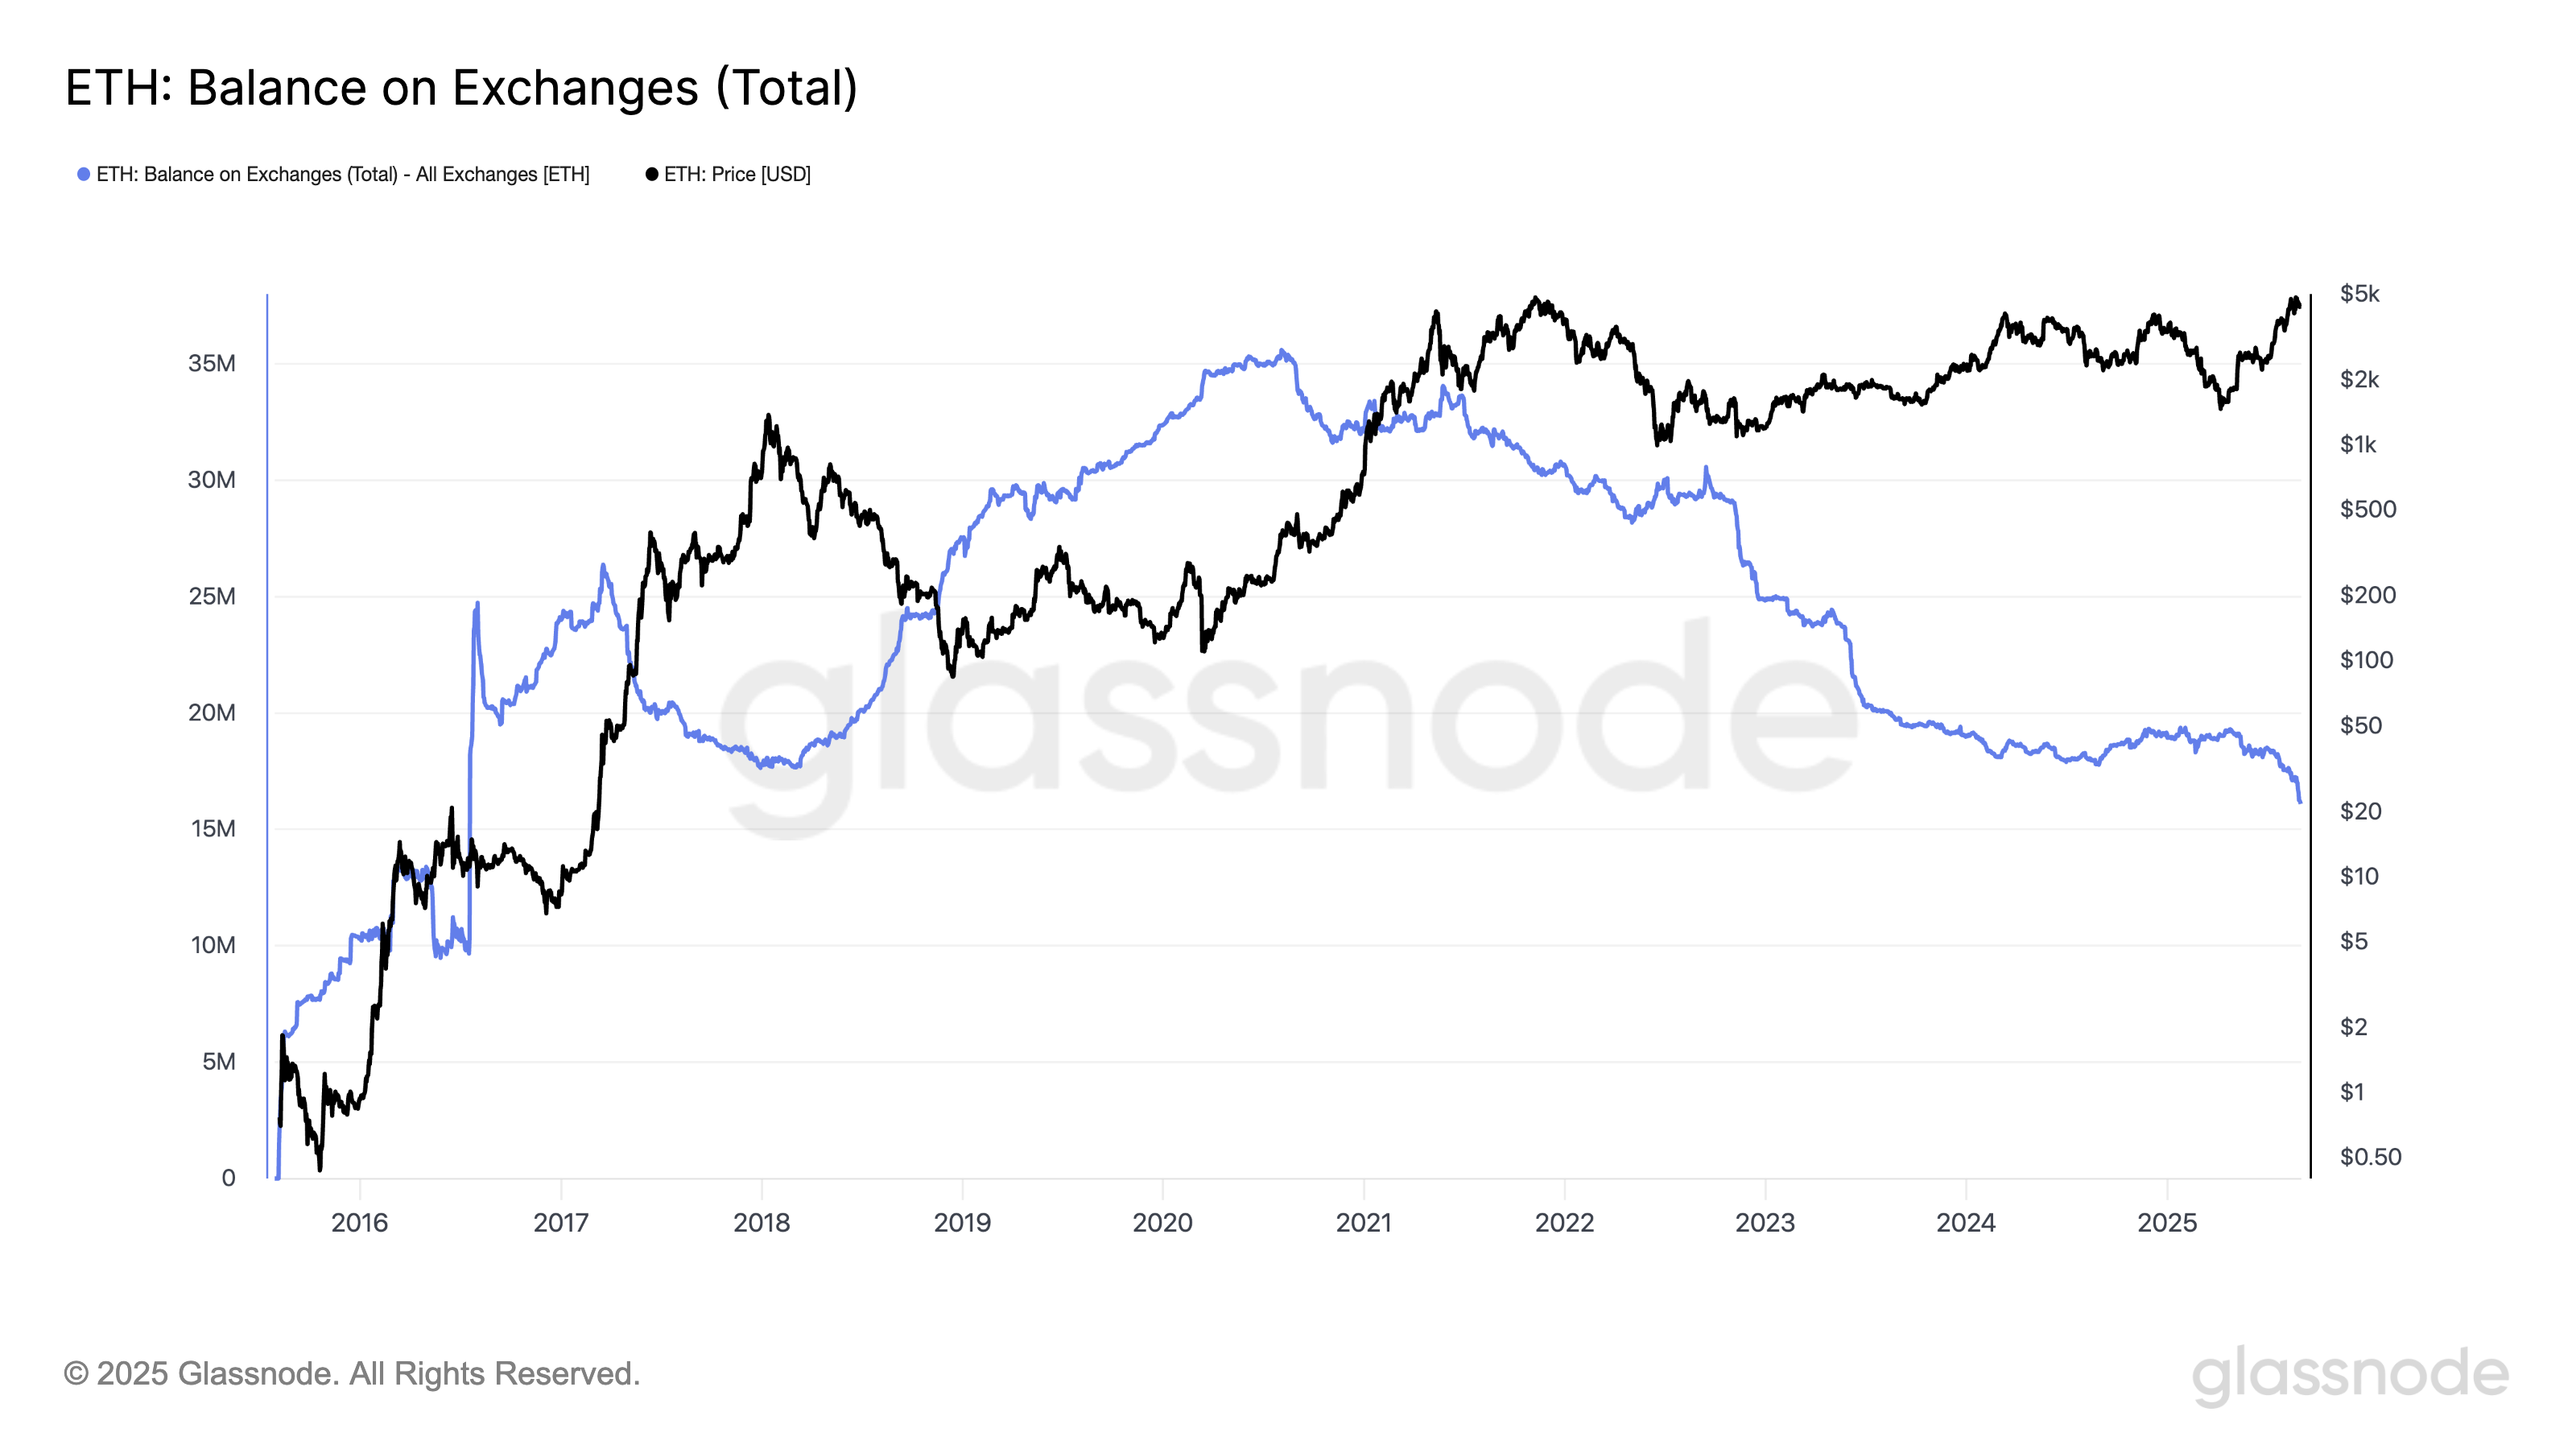 ETH Balance on Exchanges. Source: Glassnode
A decline in exchange balances suggests that investors are moving their holdings into private wallets rather than keeping them on trading platforms, a shift linked to reduced sell pressure.
When fewer coins are readily available for sale, it creates a supply squeeze that can improve upward price momentum if demand remains strong.
For ETH, this pattern reflects growing conviction among holders who appear more inclined to hold their coins in anticipation of new gains, strengthening the likelihood of a sustained rally this month.
Moreover, the coin’s rising long/short ratio supports this bullish outlook. According to CoinGlass, the ratio is currently at 1.0096, showing that more traders are now beginning to take long positions than short ones.
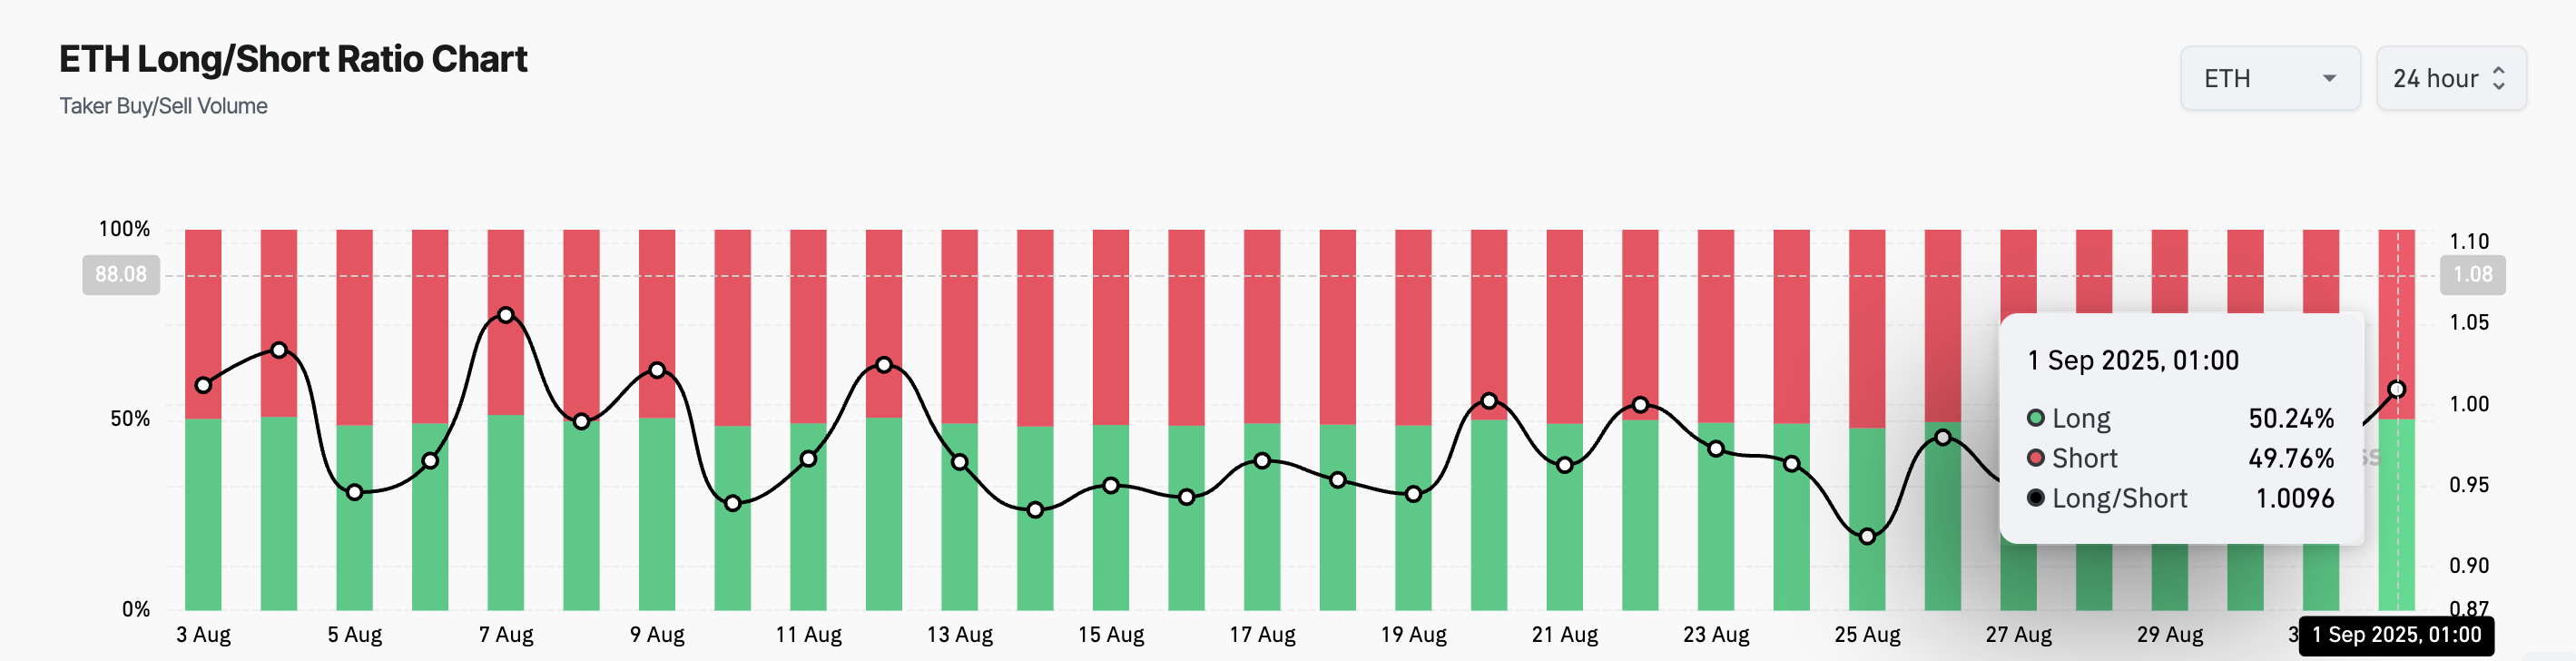 ETH Long/Short Ratio. Source: Glassnode
The long/short ratio measures the proportion of traders betting on an asset’s price rising (long) versus those expecting it to fall (short). A ratio above 1 indicates that long positions outnumber shorts, signaling stronger bullish sentiment, while a ratio below 1 suggests bearish dominance.
ETH’s climbing ratio highlights a growing tilt toward optimism among market participants. This suggests that traders are increasingly confident in the coin’s ability to sustain an upward trend over the coming weeks.
$5,000 Within Reach or Pullback to $4,221?
If buy-side pressure continues to climb, ETH could attempt a breakout above the immediate resistance at $4,664. A successful breach of this level would open the path toward its all-time high of $4,957.
Sustained bullish dominance could make a move above the $5,000 mark increasingly likely.
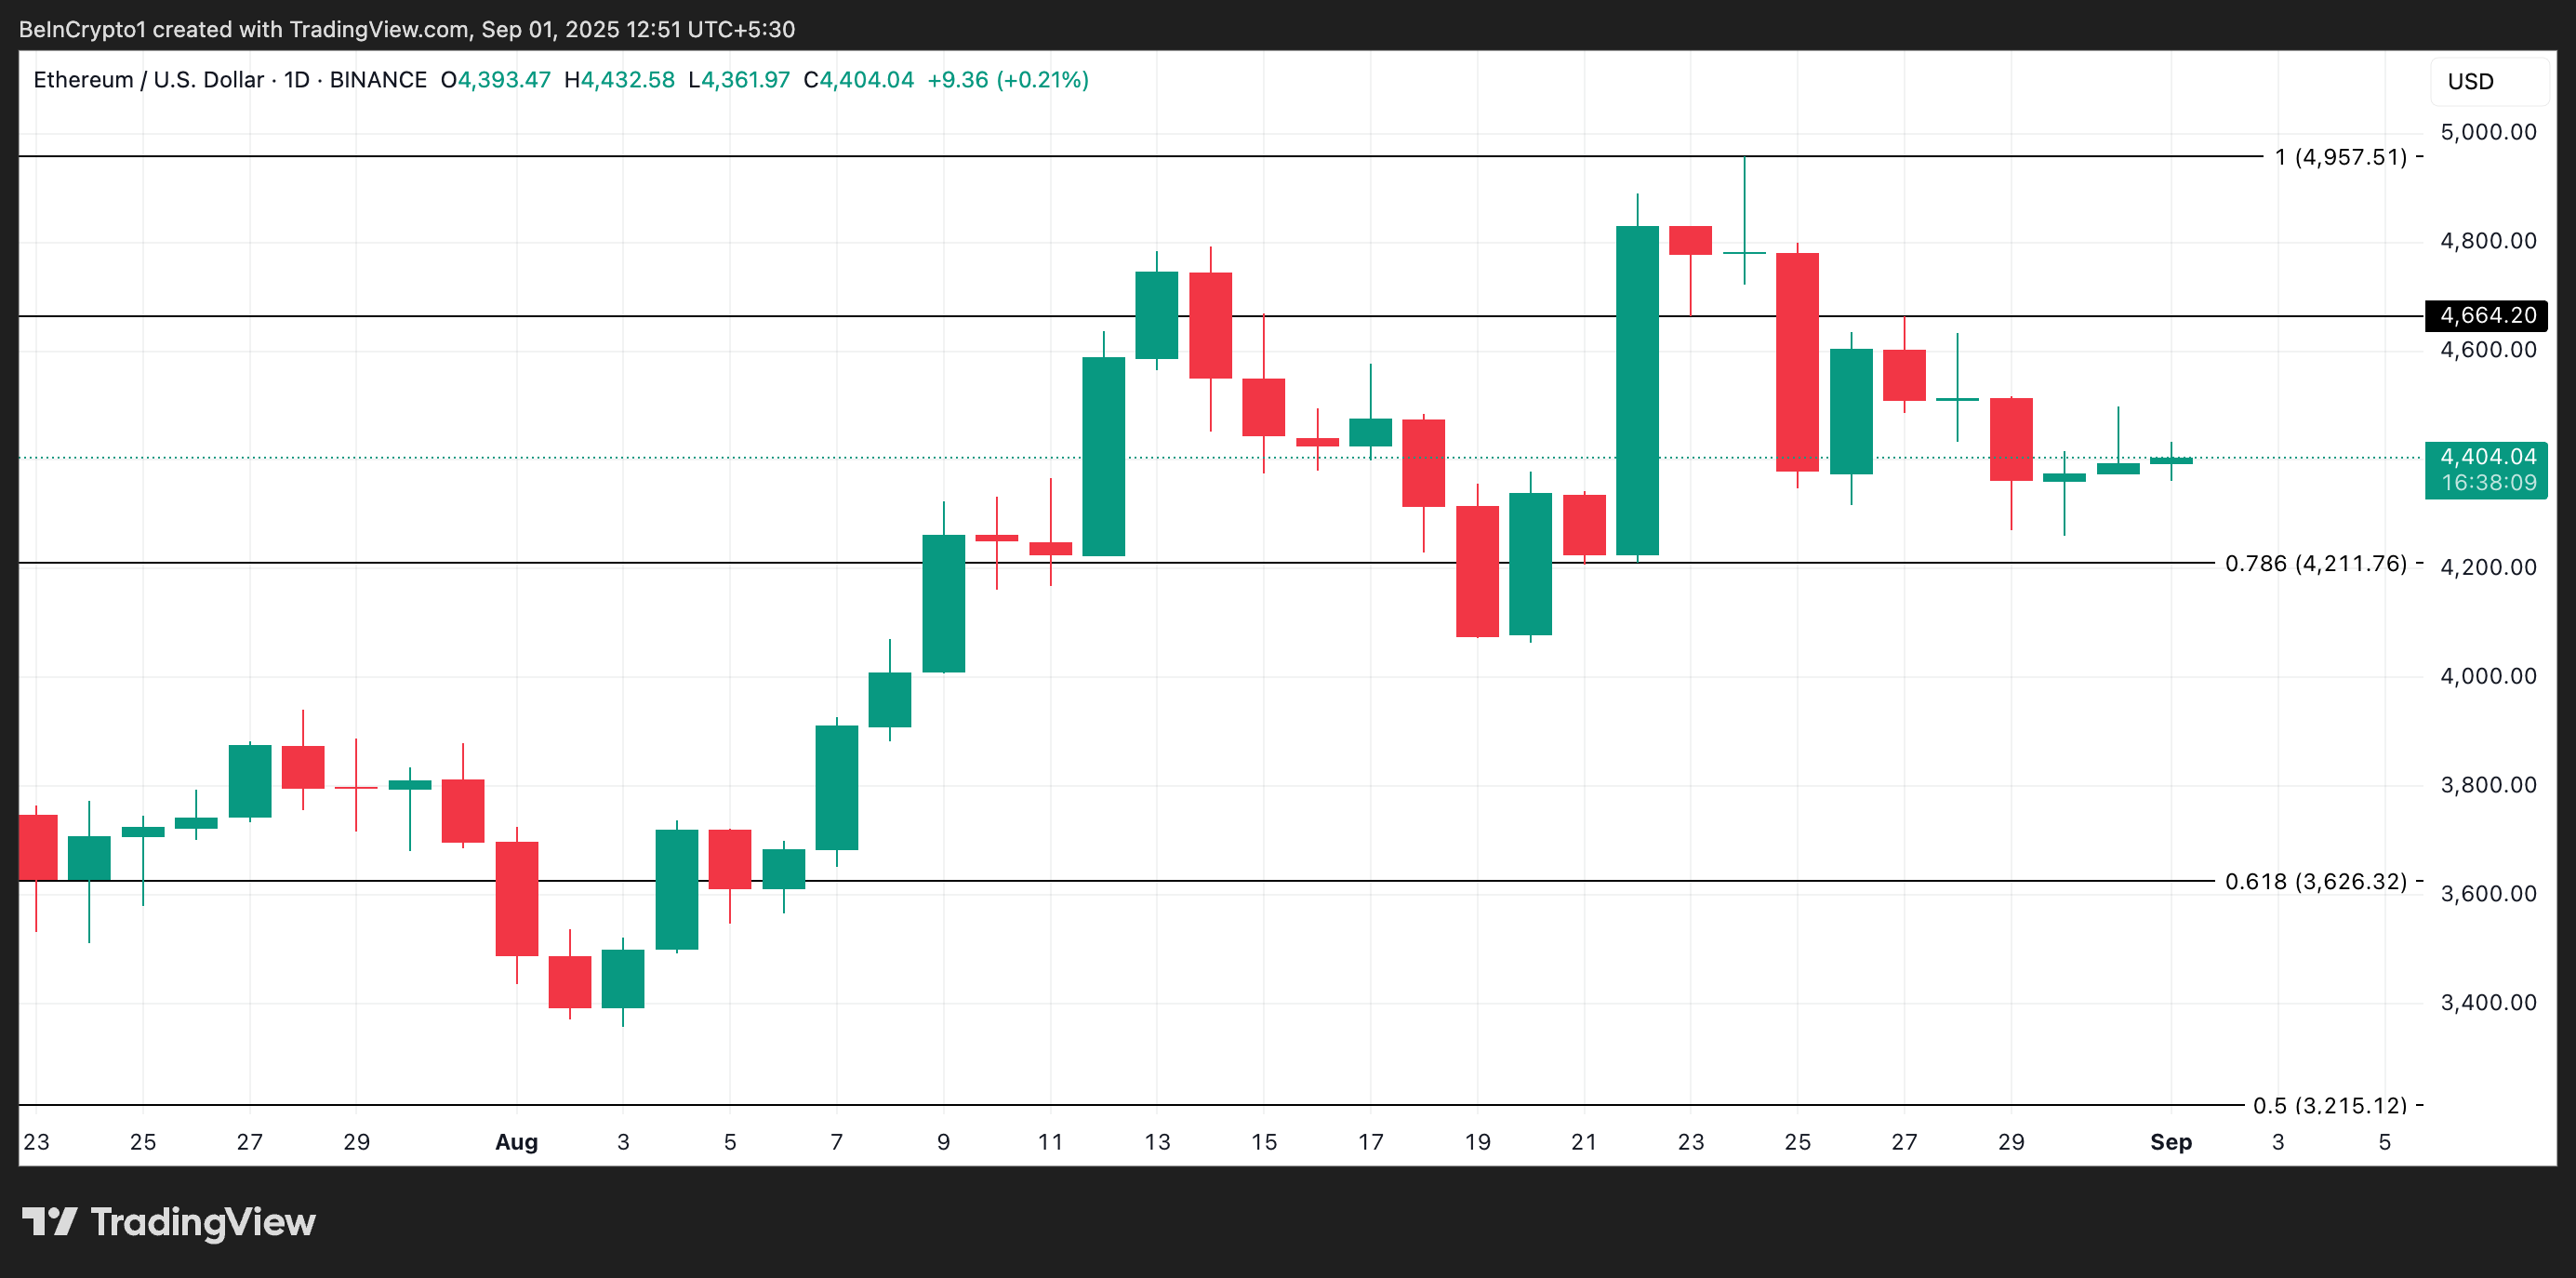 ETH Price Analysis. Source: TradingView
However, if demand slows, this bullish projection could be invalidated. In such a scenario, the coin’s price risks retracing to $4,211.
0
0


 Manage all your crypto, NFT and DeFi from one place
Securely connect the portfolio you’re using to start.


