Crypto’s Weekly Gainers and Losers: XCN, BGB Soar While BONK, TIA Slide

2
0

The crypto market saw a dip in investor sentiment last week, with a notable decline in trading activity across major assets and altcoins. This pushed the total crypto market capitalization down by $106 billion within the week.
Amid this decline, some tokens posted gains while others struggled to keep pace. Here’s a look at the top weekly performers and losers.
Crypto Market’s Top Gainers
Onyxcoin (XCN) and Bitget Token (BGB) emerged as last week’s top crypto gainers, defying broader market trends. Both tokens posted strong gains, driven by investor interest and bullish technical setups.
Onyxcoin (XCN)Among the top 100 cryptocurrencies by market capitalization, XCN is the altcoin with the most gains over the past week. Currently trading at $0.019, the token’s value has soared almost 10% in the past seven days.
On the daily chart, readings from its Moving Average Convergence Divergence (MACD) hint at the likelihood of an extended rally in the short term. At press time, XCN’s MACD line (blue) rests above the signal (yellow) and zero lines.
An asset’s MACD indicator identifies trends and momentum in its price movement. It helps traders spot potential buy or sell signals through crossovers between the MACD and signal lines. When set up this way, buying activity dominates the market, supporting further price rallies.
If the rally continues, XCN’s price could reach $0.023.
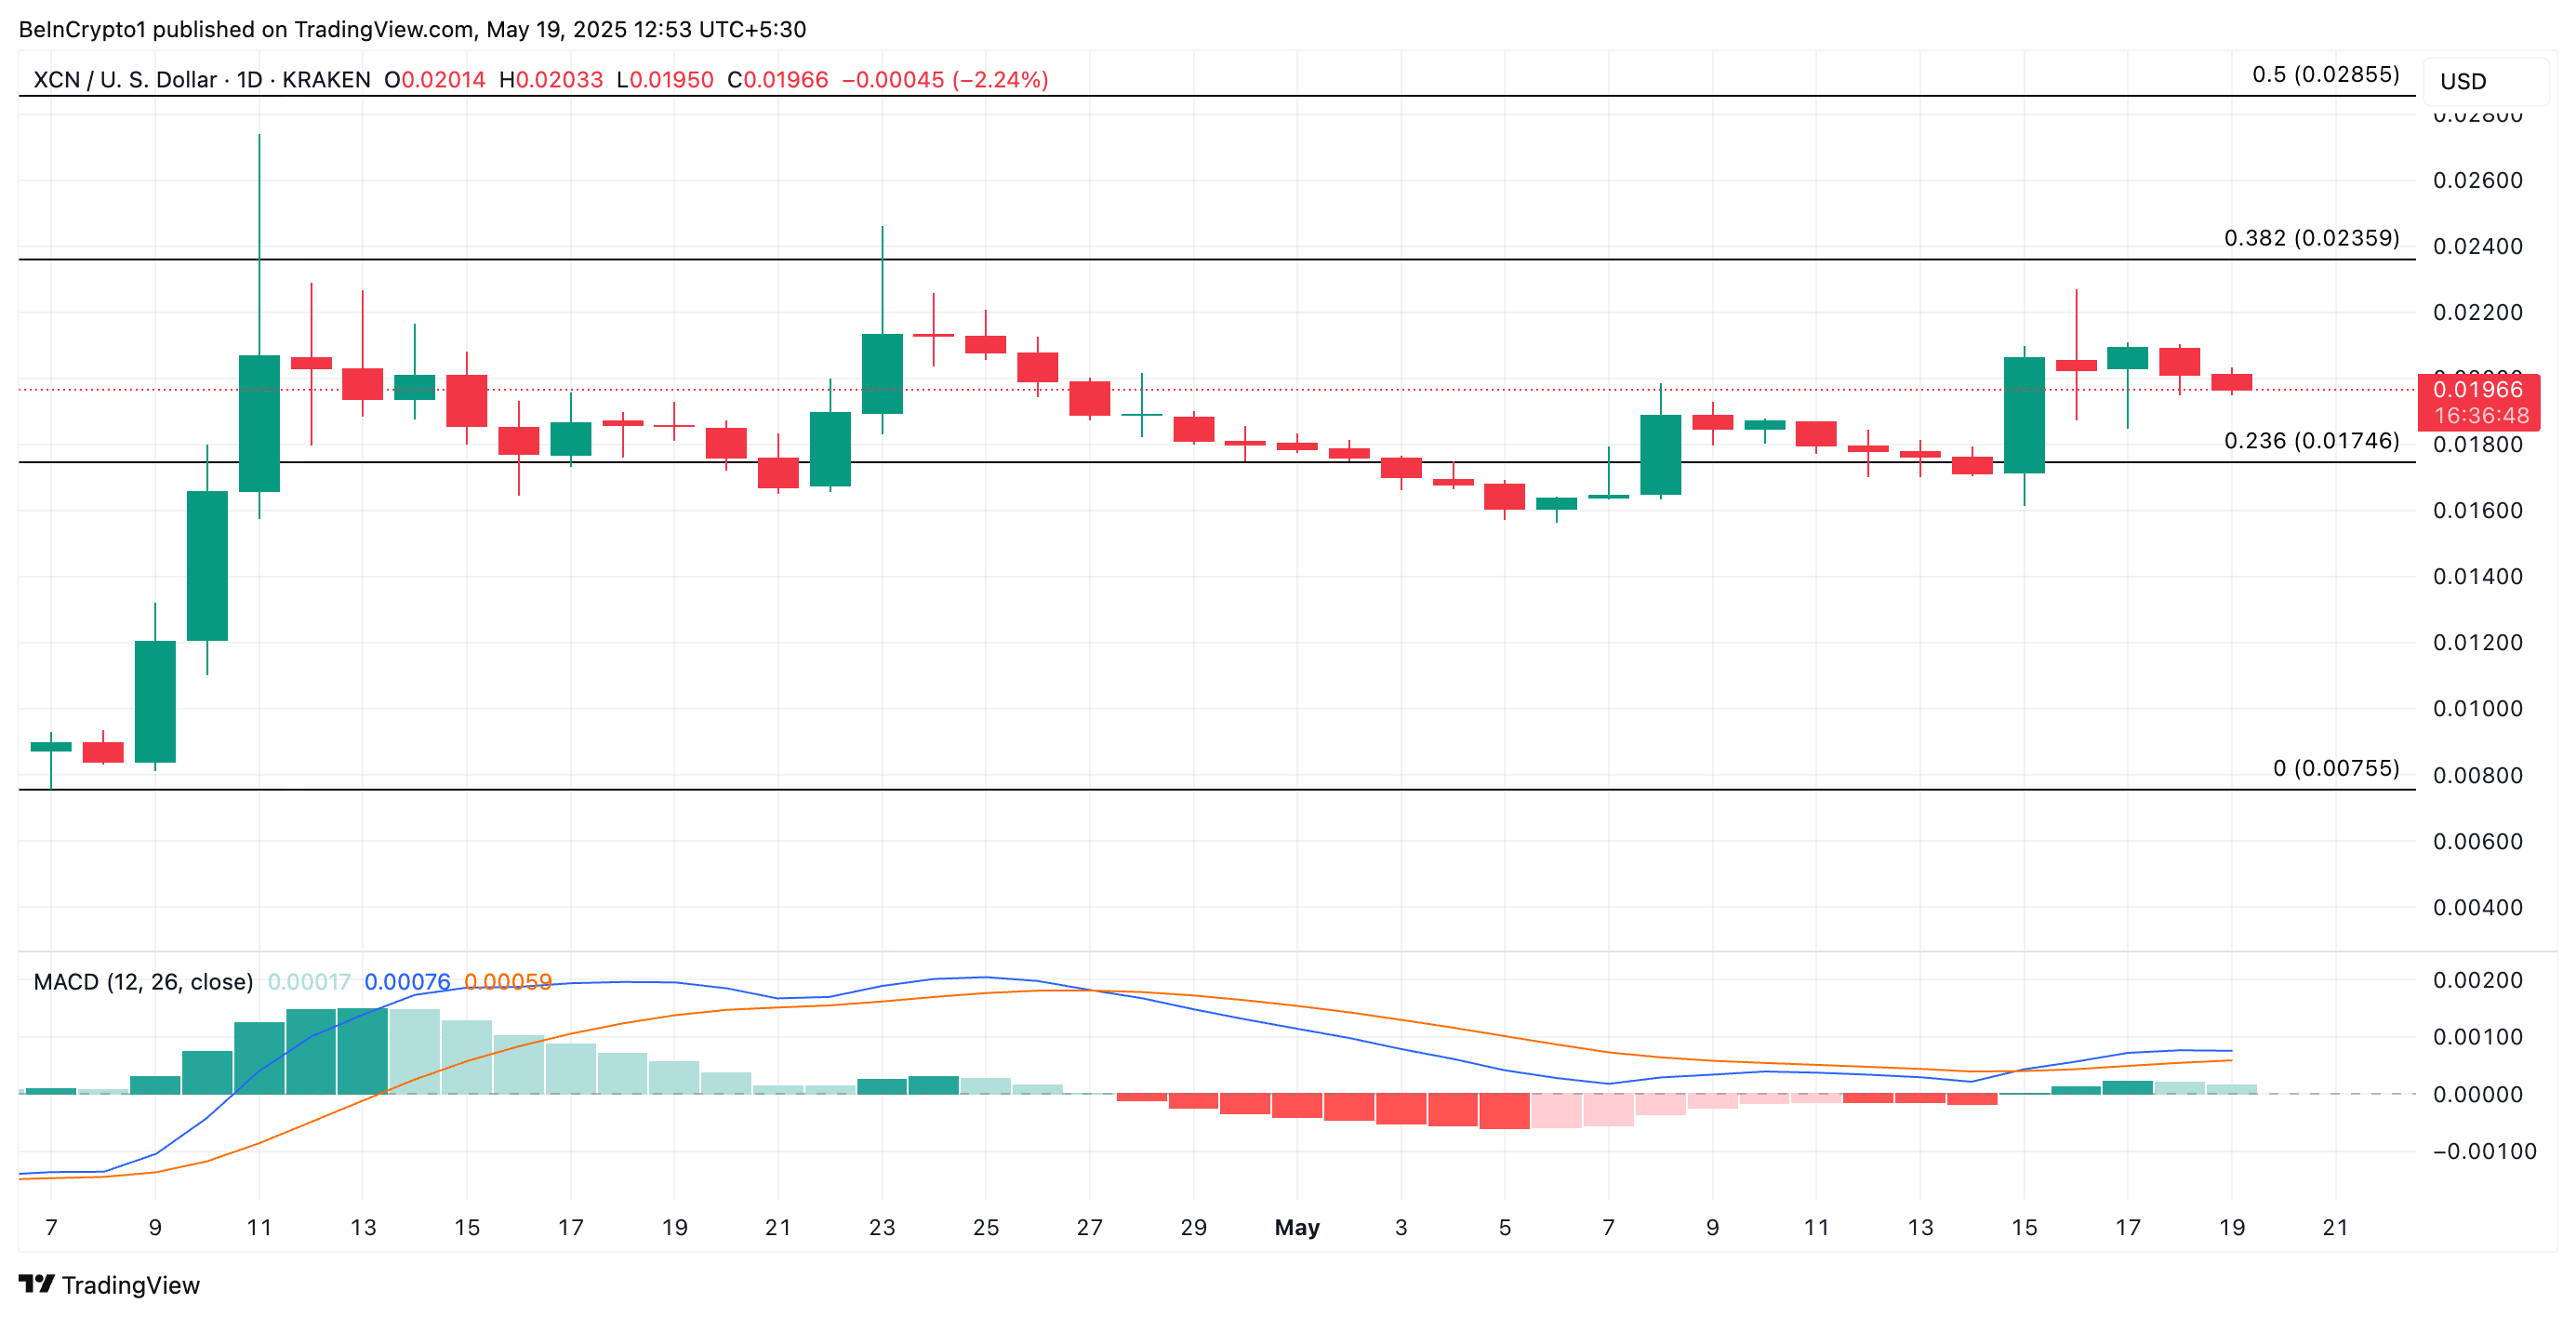 XCN Price Analysis. Source: TradingView
However, XCN could lose some of its recent gains if profit-taking commences and fall to $0.0174.
Bitget Token (BGB)BGB is the second top crypto gainer last week. Its price rallied 3%, and it currently trades at $5.17. Its rising Chaikin Money Flow (CMF) reflects the strengthening buying pressure among market participants. As of this writing, the indicator is at 0.23.
The CMF measures how money flows into and out of an asset. A positive CMF reading like this indicates that buying pressure outweighs selling pressure, suggesting capital flows steadily into the asset.
If this continues, BGB could maintain its price rise and break above the resistance at $5.31. If successful, the token could extend its gains to $6.08.
 BGB Price Analysis. Source: TradingView
Conversely, if selling commences, BGB could fall to $4.80.
Crypto Market’s Top Losers
Bonk and TIA led the crypto market’s losses last week, underperforming amid a largely sideways trading environment. Both tokens faced increased selling pressure and declining momentum.
Bonk (BONK)Solana-based meme coin BONK was one of last week’s biggest losers. The token’s price fell by 22% during that period, and it is currently trading at $0.000019.
The negative readings from the meme coin’s Balance of Power (BoP) reflect the weakening demand among market participants. The momentum indicator is in a downtrend at -0.67 at the time of writing.
The BoP indicator measures the strength of buyers versus sellers by comparing the closing price to the trading range for a given period. When its value is negative, it indicates that sellers are in control and that downward pressure is outweighing buying interest.
If selling strengthens further, it could push BONK’s price to $0.000016.
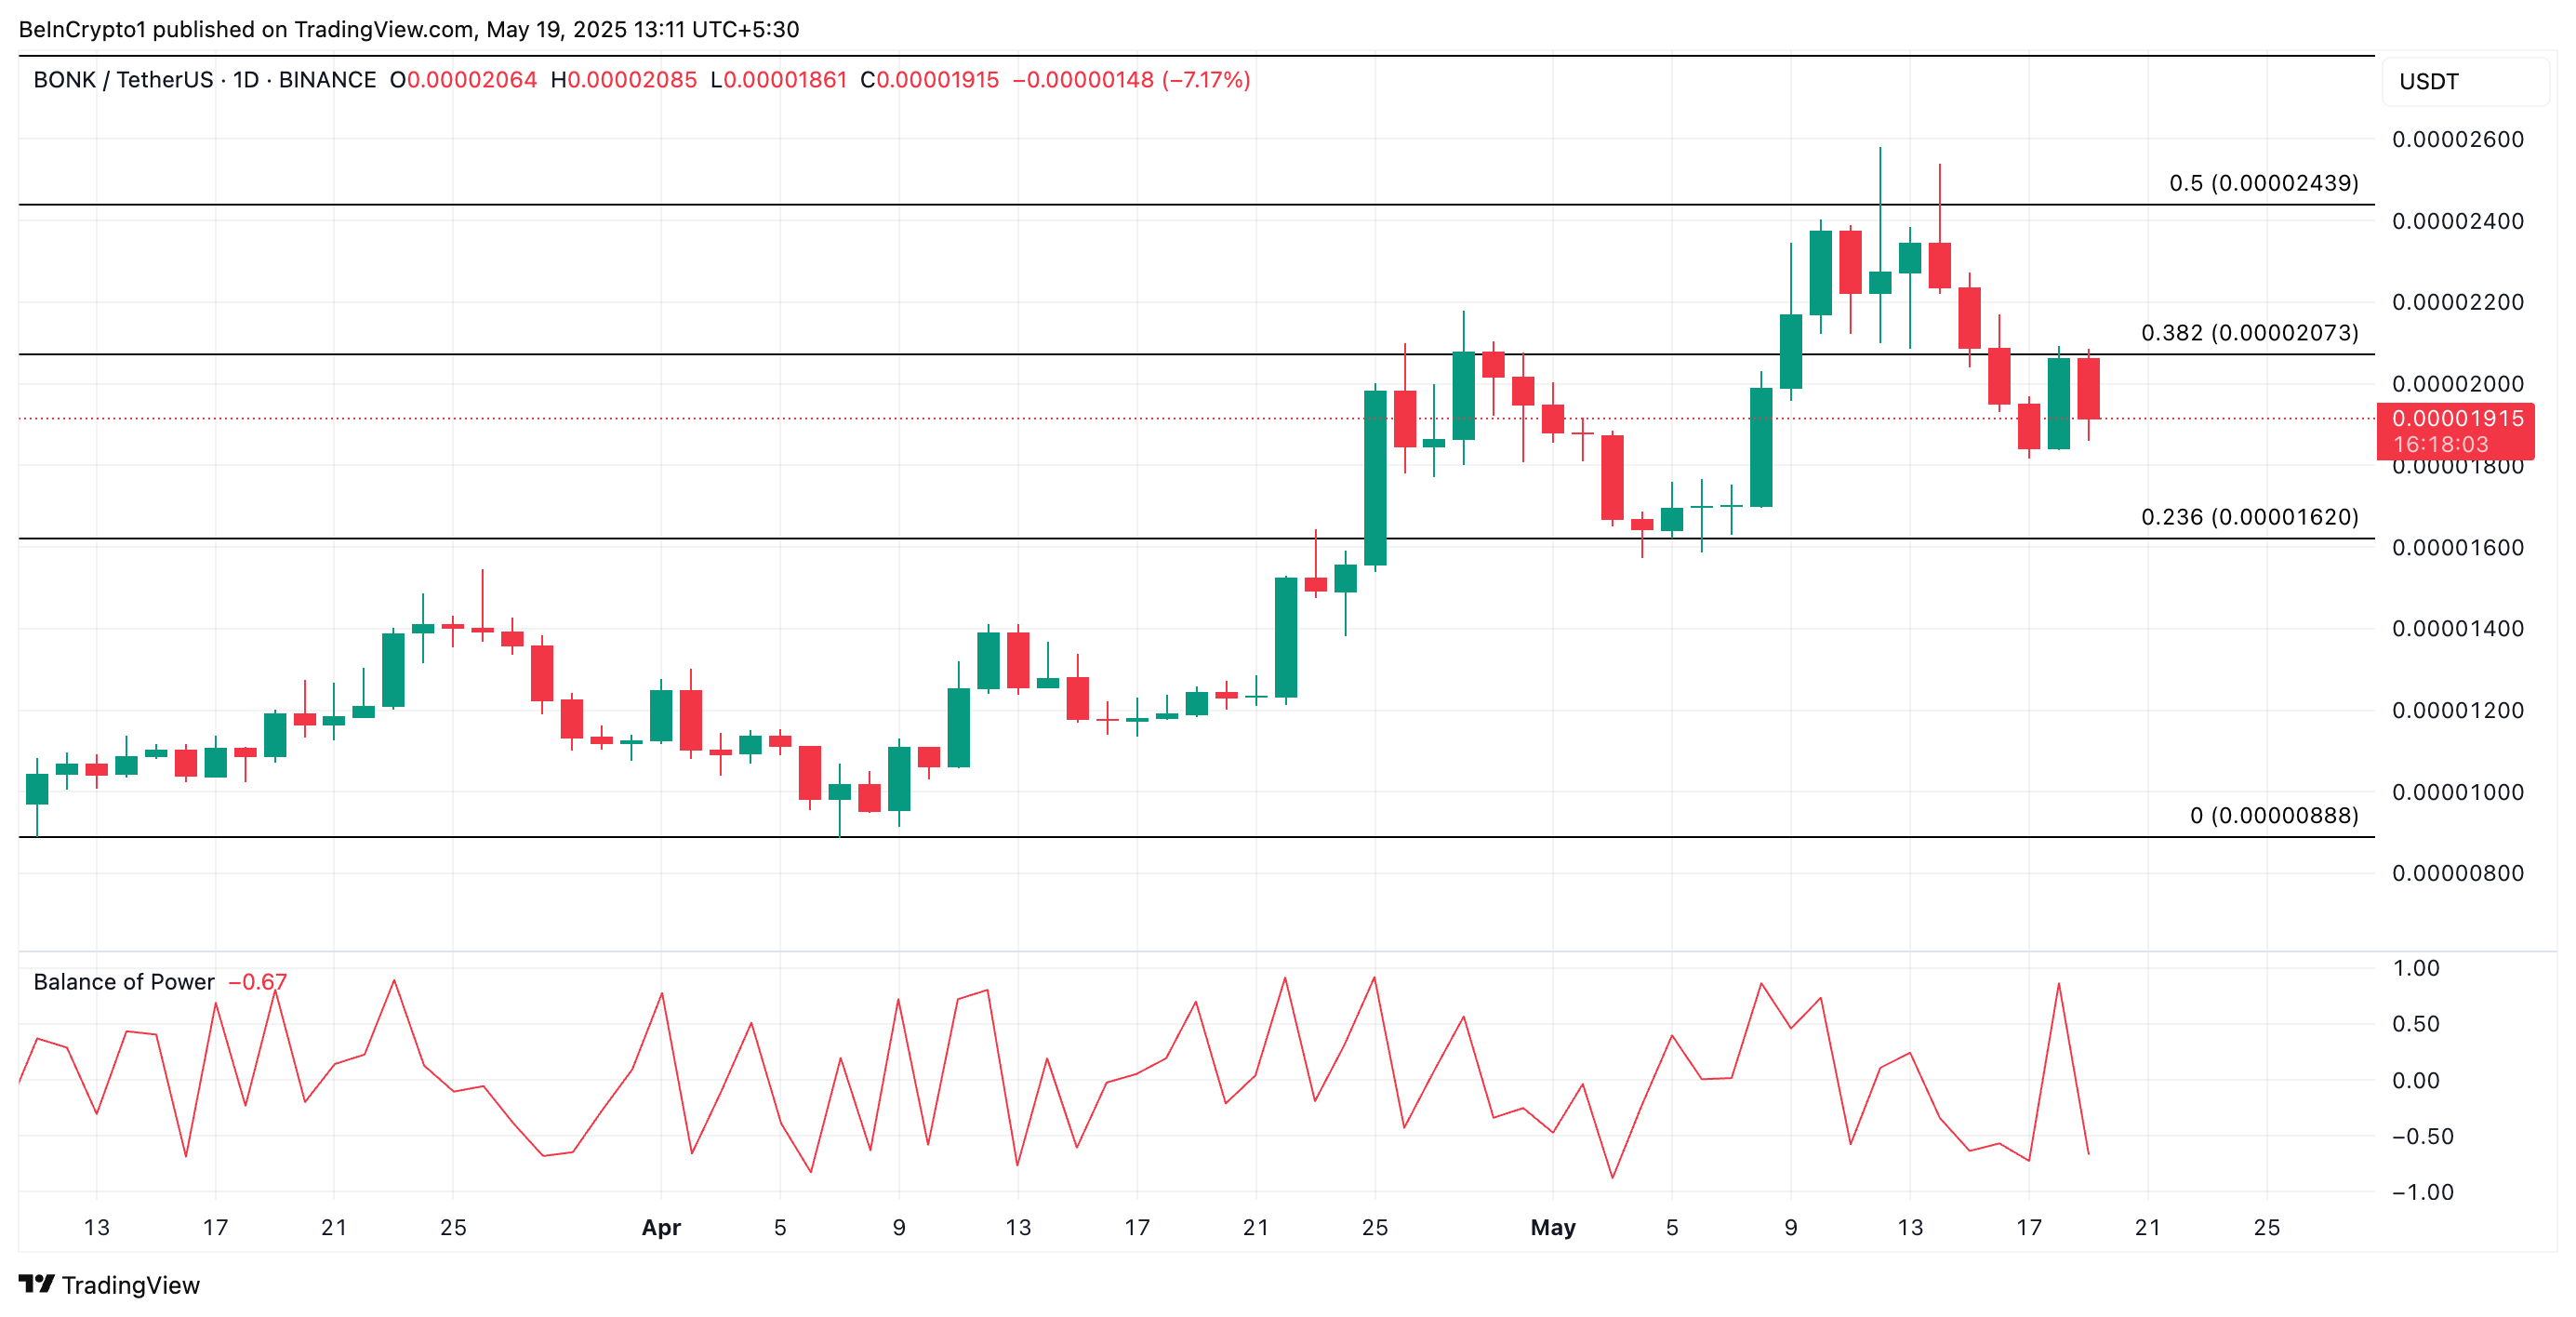 BONK Price Analysis. Source: TradingView
On the other hand, a resurgence in new demand for the meme coin will invalidate this bearish outlook. In that case, BONK’s value could rally toward $0.000020 and attempt to break above it.
Celestia (TIA)TIA has plunged 23% over the past week, making it one of the market’s steepest decliners. The altcoin currently trades at $2.56, down another 3% today as it follows the broader market’s downward trajectory.
During that period, the token’s trading volume has spiked almost 80% to reach $128 million. This creates a negative divergence that hints at further declines.
When an asset’s price declines while trading volume increases, it signals strong selling pressure. This trend indicates that bearish momentum is gaining strength among TIA holders as traders exit their trading positions.
If this continues, TIA could extend its decline to $2.14.
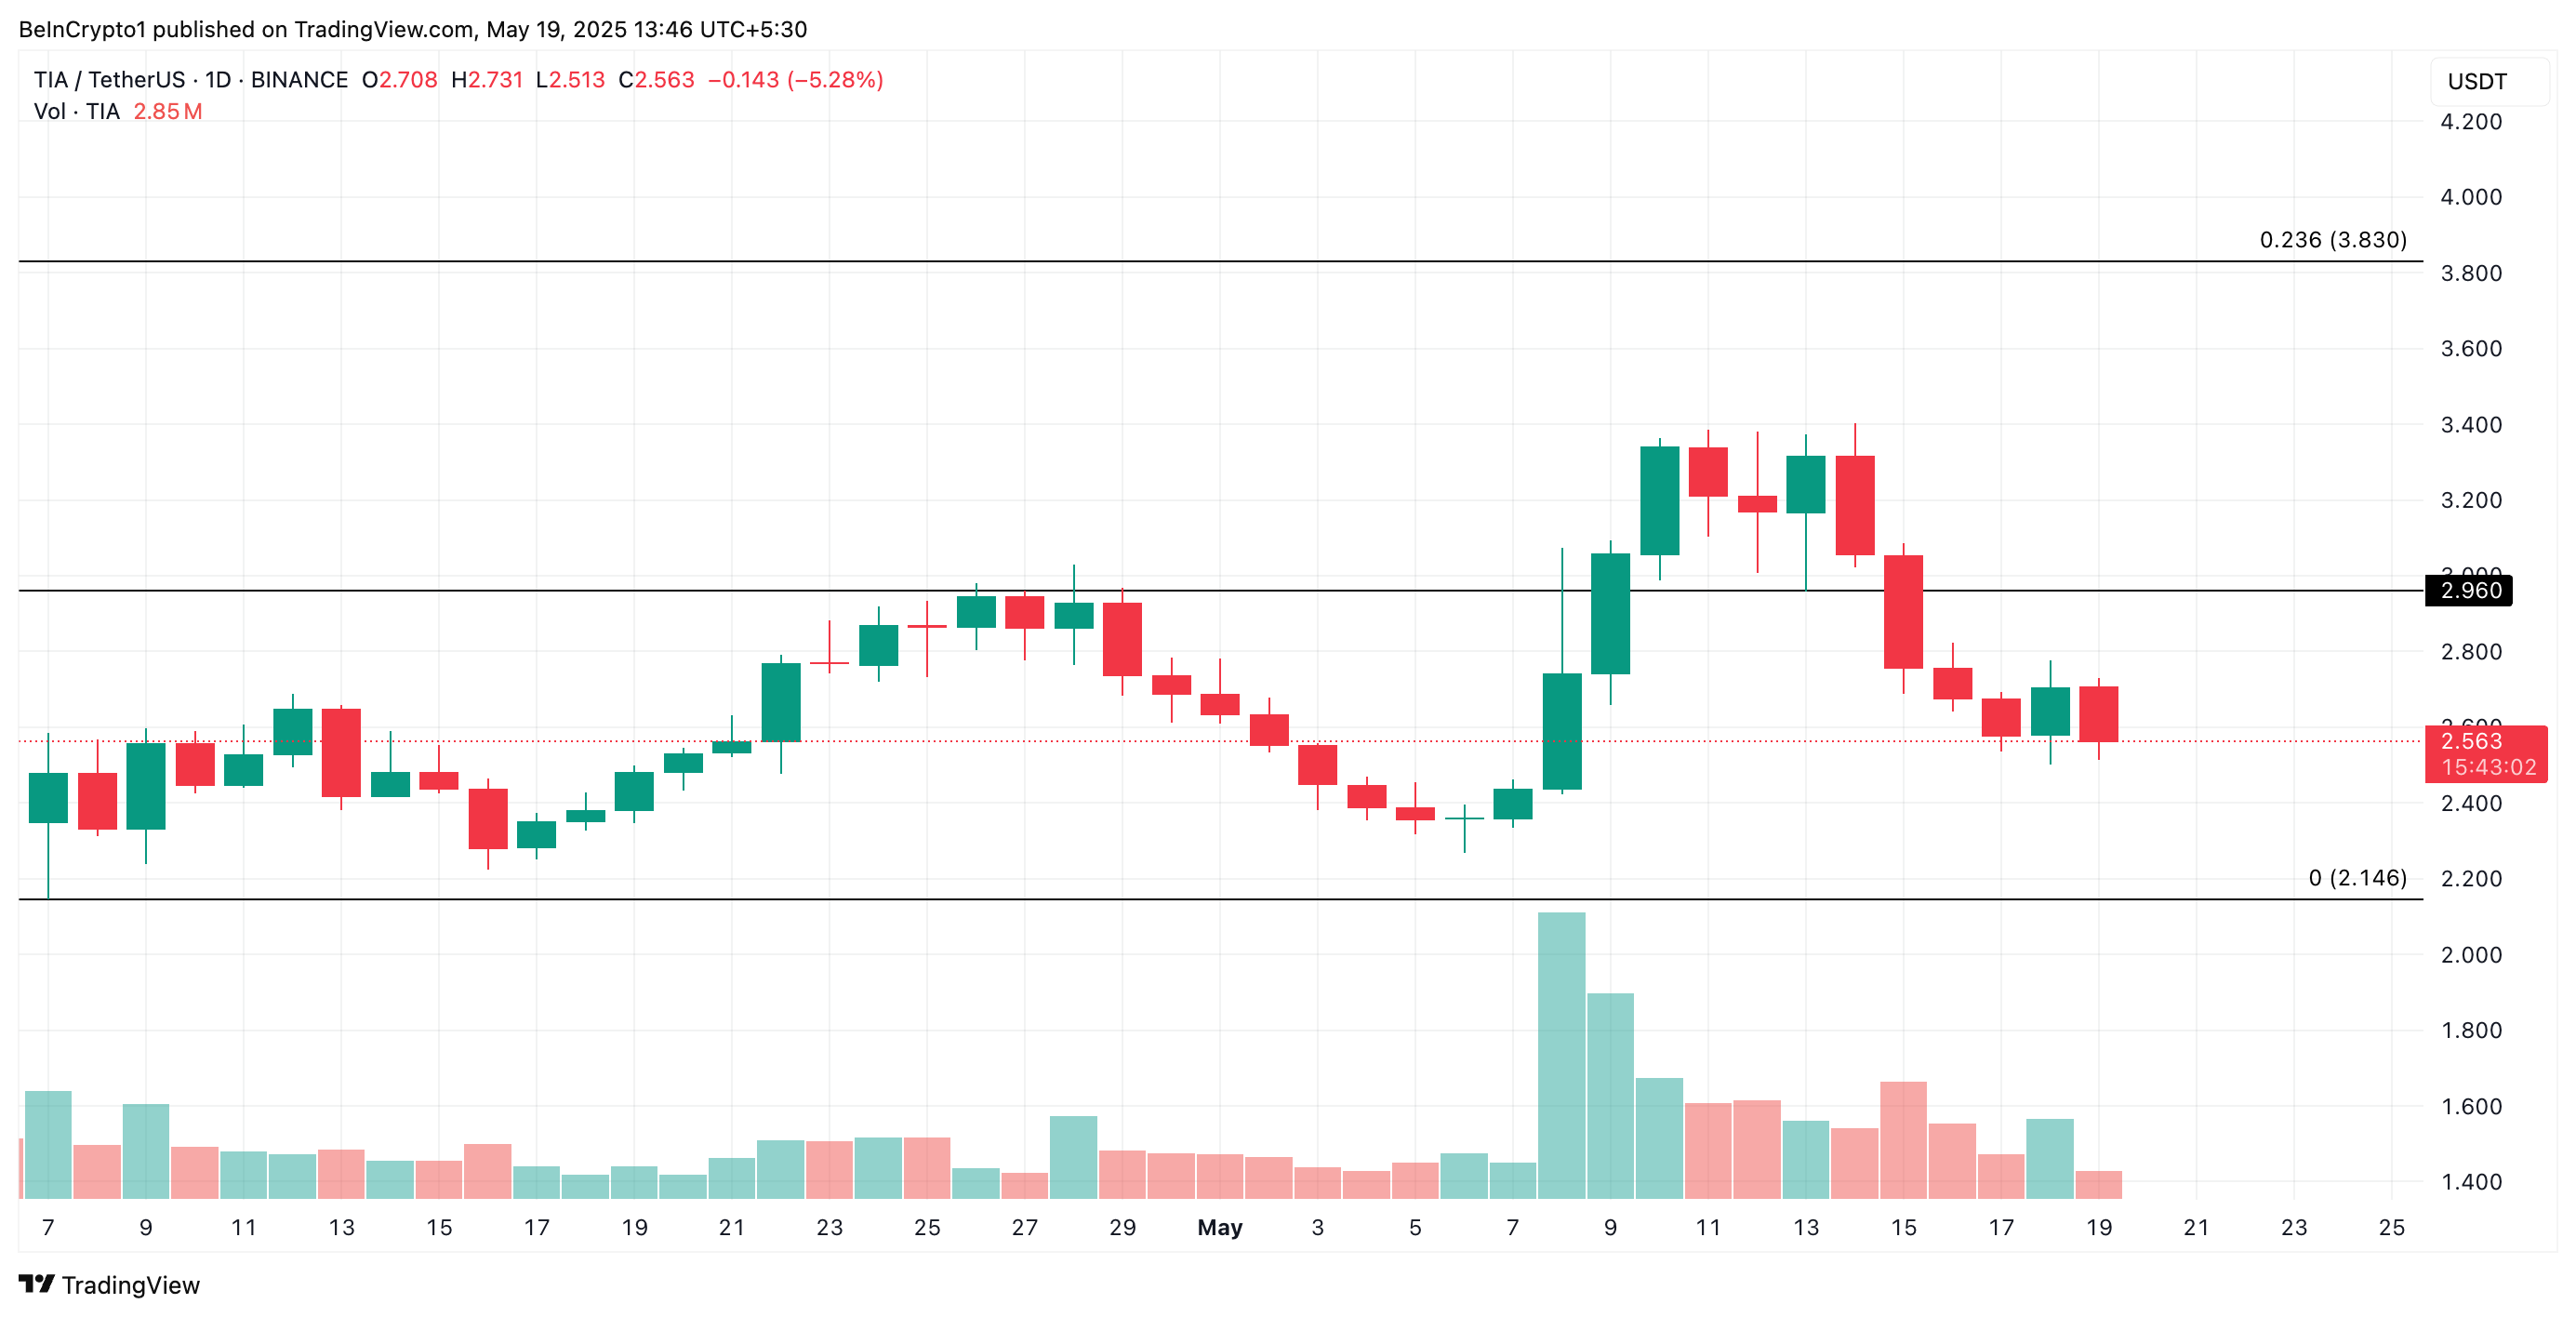 TIA Price Analysis. Source: TradingView
Conversely, if demand rockets, the token’s price could climb to $2.96.
2
0


 Manage all your crypto, NFT and DeFi from one place
Securely connect the portfolio you’re using to start.

0
0


