US Inflation Cooled, So Why Did Bitcoin and Stocks Sell Off?

0
0

US inflation delivered its biggest downside surprise in months. Yet instead of a sustained rally, both Bitcoin and US equities sold off sharply during US trading hours.
The price action puzzled many traders, but the charts point to a familiar explanation rooted in market structure, positioning, and liquidity rather than macro fundamentals.
What Happened After the US CPI Release
Headline CPI slowed to 2.7% year over year in November, well below the 3.1% forecast. Core CPI also undershot expectations at 2.6%.
On paper, this was one of the most risk-positive inflation prints of 2025. Markets initially reacted as expected. Bitcoin jumped toward the $89,000 area, while the S&P 500 spiked higher shortly after the data hit.
That rally did not last.
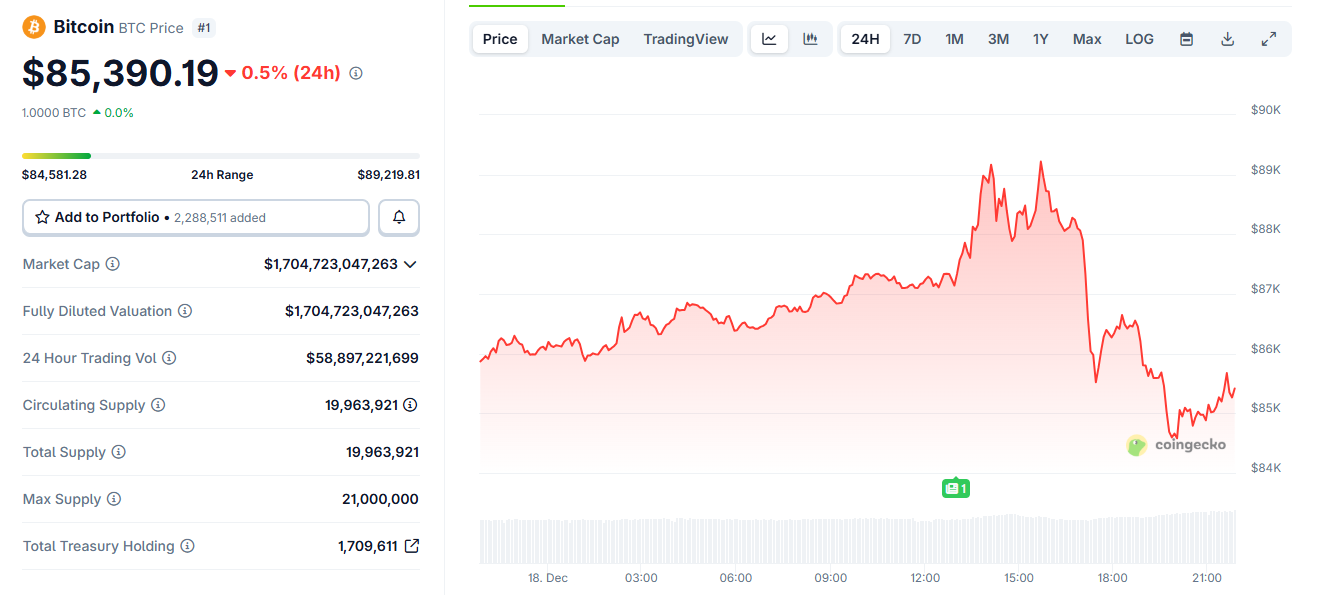 Bitcoin Price Briefly Rallies and Dumps After US CPI Data. Source: CoinGecko
Within roughly 30 minutes of the CPI print, Bitcoin reversed sharply. After tagging intraday highs near $89,200, BTC sold off aggressively, sliding toward the $85,000 area.
The S&P 500 followed a similar path, with sharp intraday swings that erased much of the initial CPI-driven gains before stabilizing.
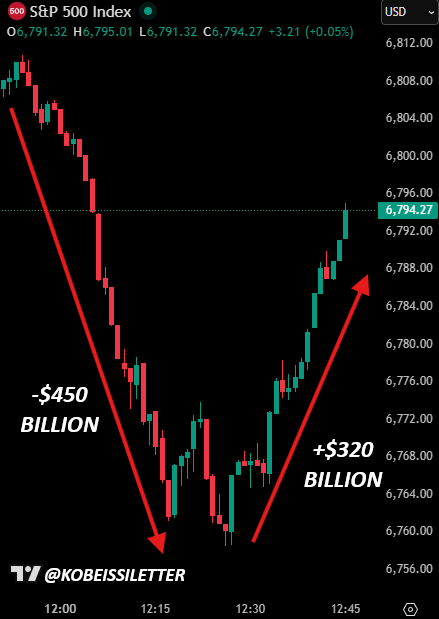 S&P 500 Sharply Drops and then Spikes After US CPI. Source: X/Kobeissi Letter
This synchronized reversal across crypto and equities matters. It signals that the move was not asset-specific or sentiment-driven. It was structural.
Bitcoin Taker Sell Volume Tells the Story
The clearest clue comes from Bitcoin’s taker sell volume data.
On the intraday chart, large spikes in taker sell volume appeared precisely as Bitcoin broke lower. Taker sells reflect market orders hitting the bid — aggressive selling, not passive profit-taking.
These spikes clustered during US market hours and coincided with the fastest part of the decline.
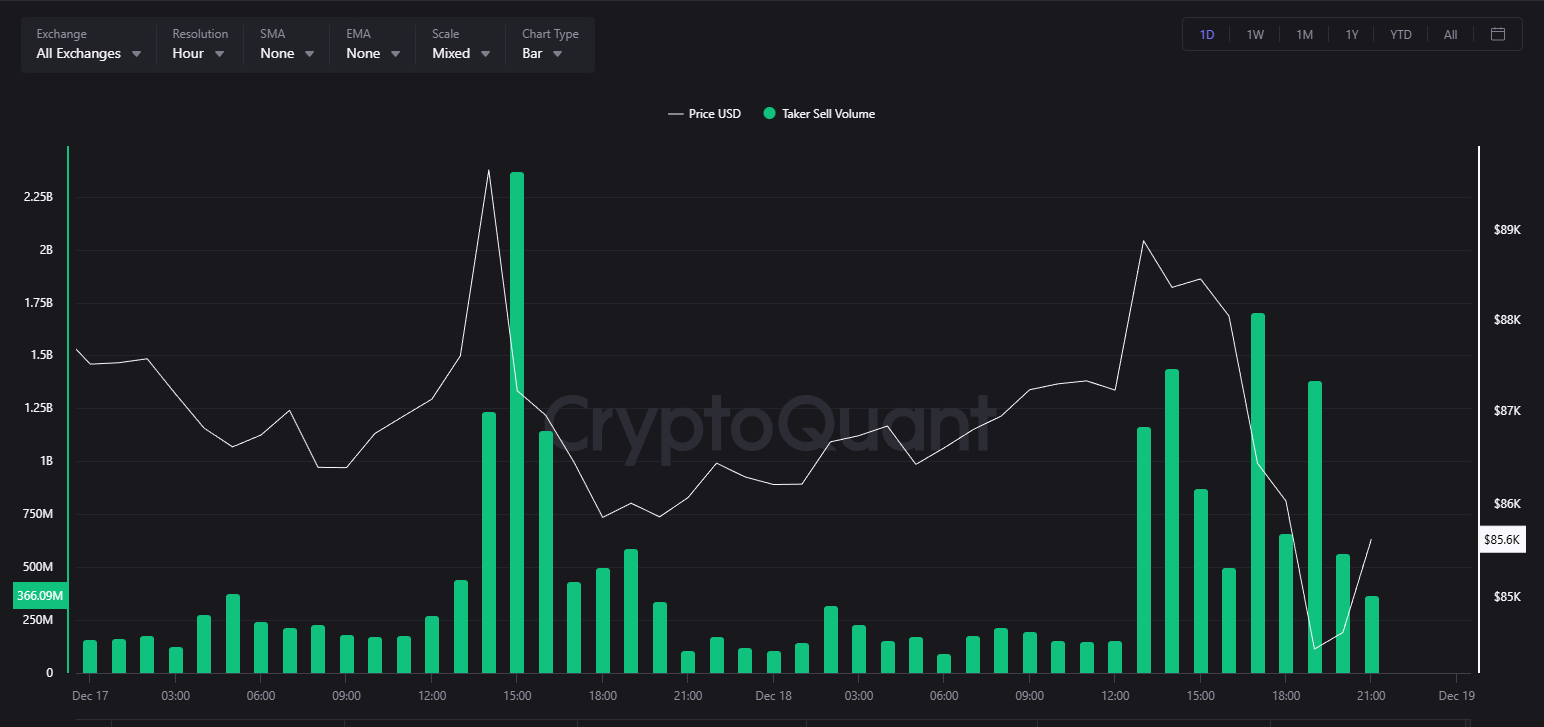 Bitcoin Taker Volume Across All Exchanges On December 18. Source: CryptoQuant
The weekly view reinforces this pattern. Similar sell-side bursts appeared multiple times over the past week, often during high-liquidity windows, suggesting repeated episodes of forced or systematic selling rather than isolated retail exits.
This behavior is consistent with liquidation cascades, volatility-targeting strategies, and algorithmic de-risking — all of which accelerate once price starts moving against leveraged positions.
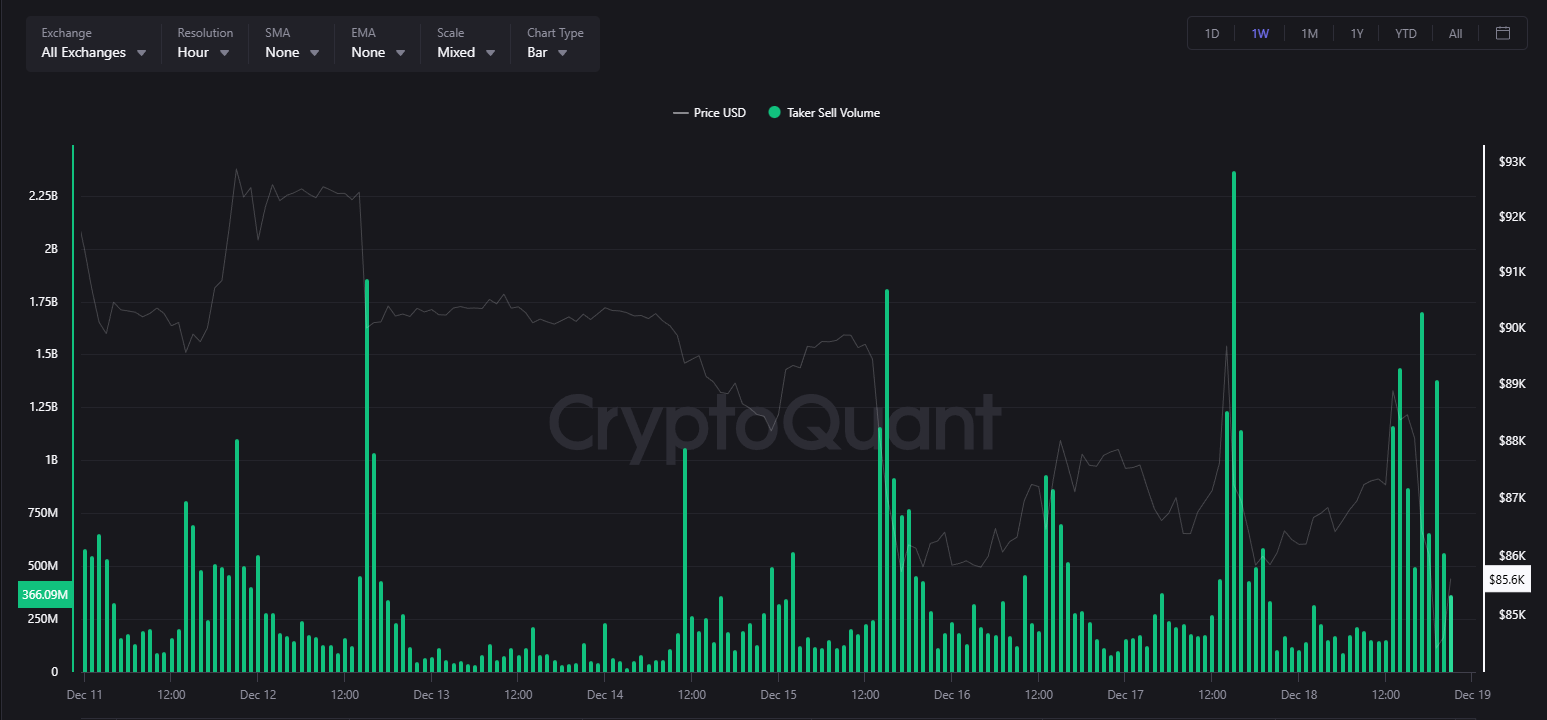 Bitcoin Taker Volume Across All Exchanges Over the Past Week. Source: CryptoQuant
Why ‘Good News’ Became the Trigger
The CPI report did not cause the selloff because it was bad. It caused volatility because it was good.
Softer inflation briefly increased liquidity and tightened spreads. That environment allows large players to execute size efficiently.
Bitcoin’s initial spike likely ran into a dense zone of resting orders, stop losses, and short-term leverage. Once upside momentum stalled, price reversed, triggering long liquidations and stop-outs.
As liquidations hit, forced market selling amplified the move. This is why the decline accelerated rather than unfolded gradually.
The S&P 500’s intraday whipsaw shows a similar dynamic. Rapid downside and recovery patterns during macro releases often reflect dealer hedging, options gamma effects, and systematic flows adjusting risk in real time.
Does This Look Like Manipulation?
The charts do not prove manipulation. But they show patterns commonly associated with stop-runs and liquidity extraction:
- Fast moves into obvious technical levels
- Reversals immediately after liquidity improves
- Large bursts of aggressive selling during breakdowns
- Tight alignment with US trading hours
These behaviors are typical in highly leveraged markets. The most likely drivers are not individuals, but large funds, market makers, and systematic strategies operating across futures, options, and spot markets. Their goal is not narrative control, but execution efficiency and risk management.
In crypto, where leverage remains high and liquidity thins quickly outside key windows, these flows can look extreme.
What This Means Going Forward
The selloff does not invalidate the CPI signal. Inflation genuinely cooled, and that remains supportive for risk assets over time. What the market experienced was a short-term positioning reset, not a macro reversal.
In the near term, traders will watch whether Bitcoin can stabilize above recent support and whether sell-side pressure fades as liquidations clear.
If taker sell volume subsides and price holds, the CPI data may still assert itself over the coming sessions.
0
0


 Manage all your crypto, NFT and DeFi from one place
Securely connect the portfolio you’re using to start.


0
0