Blockchainreporter: Daily Crypto Market Analysis

7
5

- Bitcoin (BTC) Analysis
- Ethereum (ETH) Analysis
- Cardano (ADA) Analysis
- Polygon (MATIC) Analysis
- Ripple (XRP) Analysis
- VIMworld (VEED) Analysis
- Bitcoin Cash (BCH) Analysis
- Serum (SRM) Analysis
- VeChain (VET) Analysis
The race among major financial firms to secure a spot for a Bitcoin Exchange-Traded Fund (ETF), including industry giants like BlackRock and WisdomTree, has captured the attention of investors and enthusiasts alike. Simultaneously, the launch of the EDX Market exchange, backed by Fidelity Investments, has injected renewed optimism into the market. These developments have contributed to Bitcoin’s and altcoins’ upward trajectory, propelling the crypto market to new heights.
Bitcoin (BTC) Analysis

Bitcoin has shown slight upward movement in the last 24 hours, with a price of $30,657, reflecting a 0.26% increase. Over the past week, Bitcoin has demonstrated significant growth, with a 15.90% increase. This positive trend may be attributed to several factors, including increased institutional interest, growing acceptance of cryptocurrencies, and favorable market sentiment.
There is a renewed push from buyers to maintain the price above the $31,000 level. If successful, the BTC/USDT pair has the potential to climb toward $32,400 initially and subsequently aim for the next significant resistance at $40,000. The 20-day exponential moving average (EMA), currently at $27,561, has turned upward, indicating a bullish trend.
Furthermore, the relative strength index (RSI) is in the overbought zone, reinforcing the notion that bulls are currently in control. However, this bullish view could be invalidated if the price fails to sustain above $28,500 in the near term. In such a scenario, the pair might enter a range-bound phase with support between $31,000 and $24,800.
Ethereum (ETH) Analysis

Ethereum has also experienced a slight upward movement, with a 0.79% increase in the last 24 hours, bringing its price to $1,896. Over the past week, Ethereum has shown steady growth of 9.85%. After buying the intraday dips, the bulls successfully drove the price toward the overhead resistance level of $1,928. If this resistance level is surpassed, it would indicate that buyers are showing interest in lower price levels.
This development could potentially strengthen the possibility of a rally towards $2,000 and even $2,200. However, if the price reverses course and breaks below the moving averages, it would indicate that bears are actively selling during rallies near $2,000. In such a scenario, the ETH/USDT pair might experience a decline toward the 20-day (EMA) currently located at $1,804.
Cardano (ADA) Analysis

Cardano has seen a 0.79% increase in the last 24 hours, with a current price of $0.294. Over the past week, Cardano has shown a growth of 10.76%. The bulls are determined and are making another attempt to push the price above the breakdown level of $0.30. If successful, it would signify the beginning of a stronger recovery toward the 50-day simple moving average (SMA) at $0.34.
Alternatively, there is a possibility that the price experiences a sharp downturn from the overhead resistance. In such a scenario, the likelihood of consolidation between the $0.24 and $0.30 levels would increase. For the bears to initiate the next leg of the downtrend, they would need to force the ADA/USDT pair below the $0.24 support level.
Polygon (MATIC) Analysis
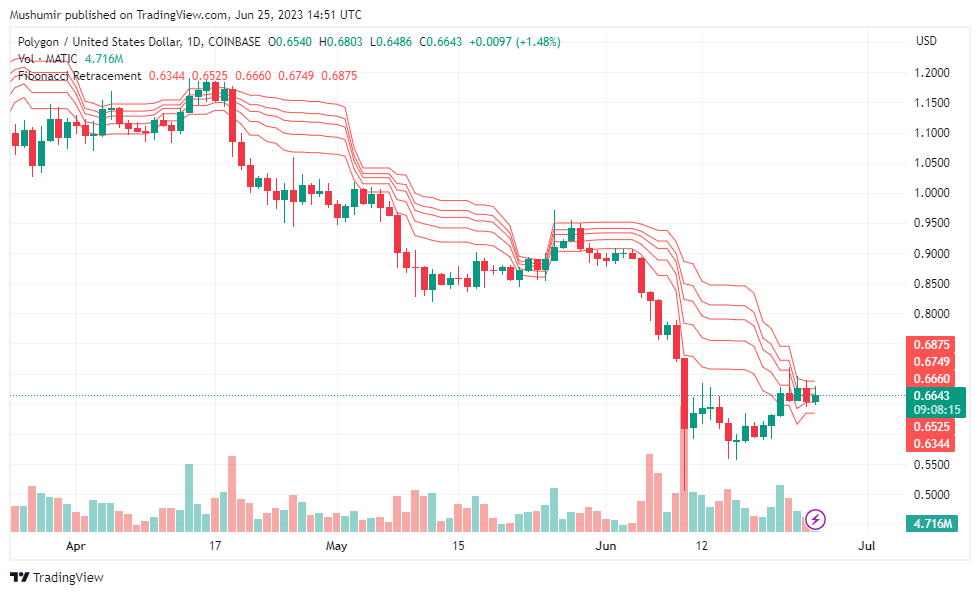
Polygon has experienced a 0.77% increase in the last 24 hours, with a current price of $0.6643. Over the past week, Polygon has shown a growth of 9.77%. The bulls have shown resilience by preventing a significant decline in price from the overhead resistance, which is a minor positive signal. This indicates that the bulls are holding their positions in anticipation of a potential upward move.
If buyers can push the price above the $0.69 level and maintain it, it could trigger a stronger recovery towards the 50-day SMA at $0.80. Although this level might pose a challenge, clearing it could lead the MATIC/USDT pair to surge toward $1.
Ripple (XRP) Analysis
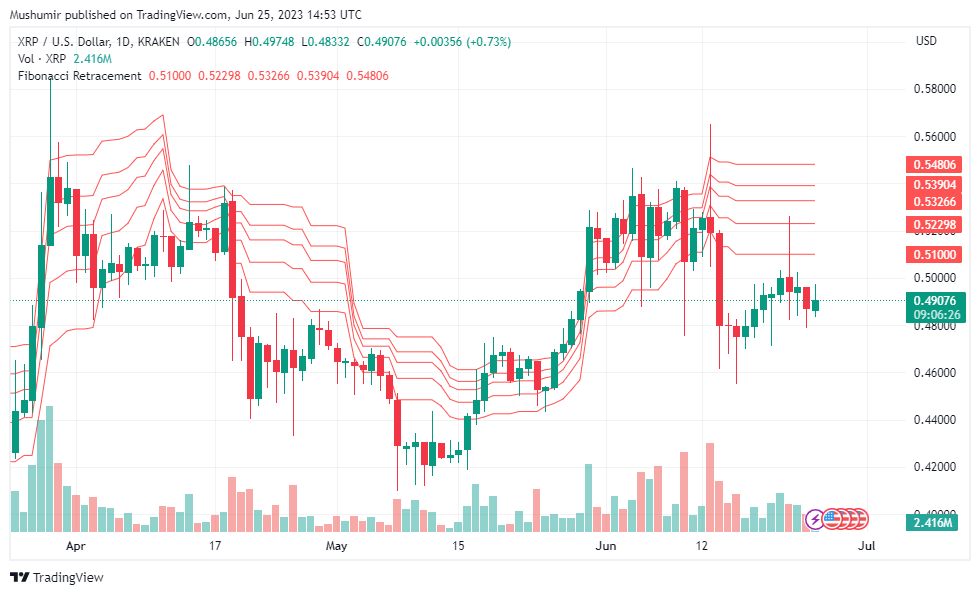
Ripple has seen a 0.83% increase in the last 24 hours, with a current price of $0.49076. Over the past week, Ripple has shown a modest growth of 1.14%. The relatively flat 20-day EMA and the RSI hovering around the midpoint indicate a balance between supply and demand in the XRP/USDT pair. This equilibrium could keep the price range bound between the 50-day SMA at $0.47 and the overhead resistance level of $0.56 for the next few days.
VIMworld (VEED) Analysis
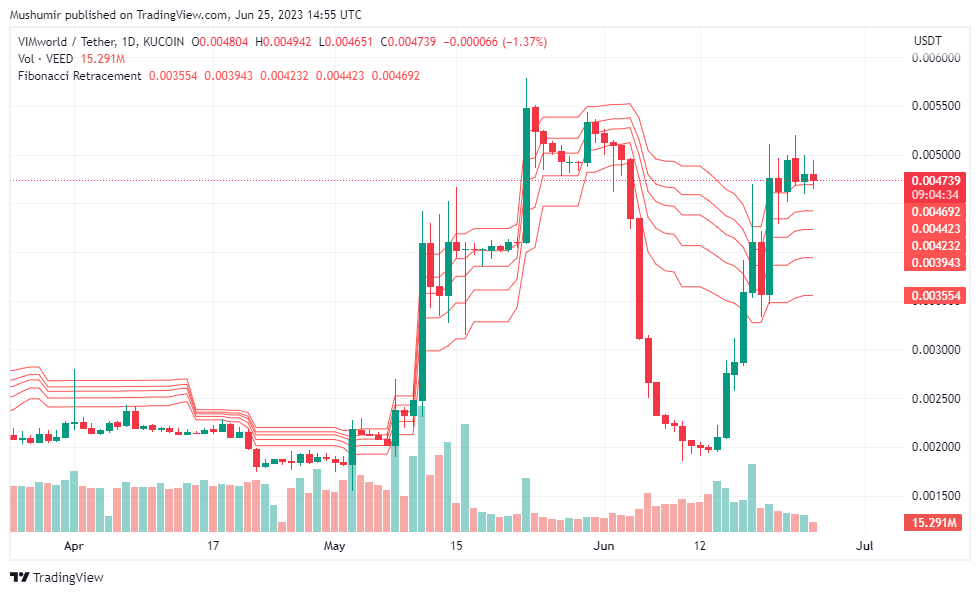
VIMworld has shown a 3.4% decrease in the last 24 hours, with a current price of $0.004739. However, over the past week, VIMworld has demonstrated substantial growth, with an increase of 99.94%. VIMworld is a blockchain-based virtual museum platform that enables the creation, ownership, and trading of virtual items. The recent surge in VIMworld’s value may be attributed to increased interest in the NFT market and the unique offerings of the platform.
Bitcoin Cash (BCH) Analysis
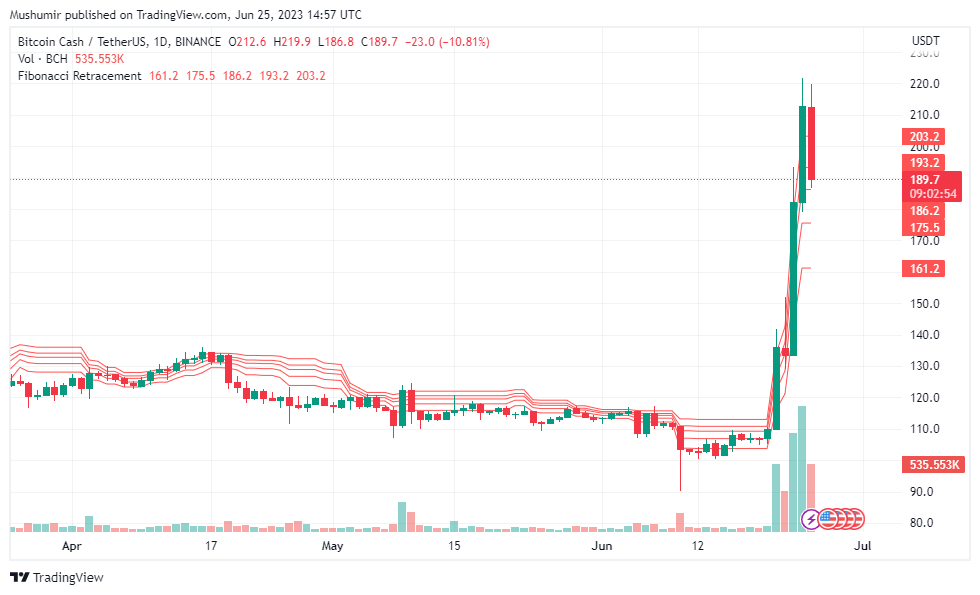
Bitcoin Cash has experienced a 2.09% increase in the last 24 hours, with a current price of $189.7. Over the past week, Bitcoin Cash has shown a substantial growth of 80.19%.
Despite experiencing a significant surge this week, the trajectory of BCH suggests a bullish trend in the short term. Currently, the price is struggling to surpass an hourly resistance level set at $191. If buyers succeed in surpassing this level, there is a possibility of the bullish momentum continuing and pushing the price toward the desired range of $200.
Serum (SRM) Analysis
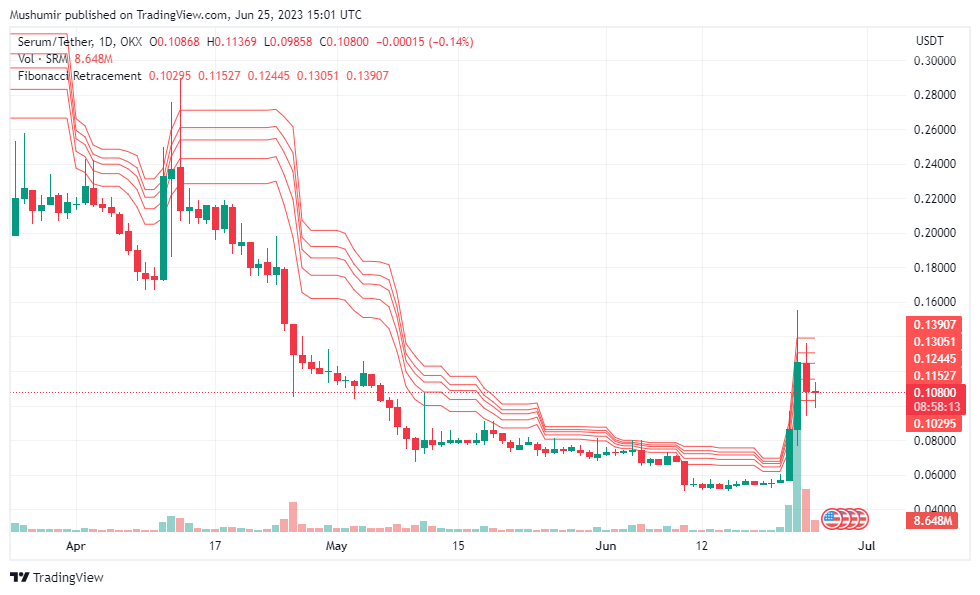
Serum has shown a 0.75% increase in the last 24 hours, with a current price of $0.10800. Over the past week, Serum has demonstrated impressive growth of 93.67%. Serum is a decentralized exchange (DEX) built on the Solana blockchain, aiming to offer fast and low-cost trading. The recent surge in Serum’s value can be attributed to the growing interest in decentralized finance (DeFi) and the Solana ecosystem.
VeChain (VET) Analysis

VeChain has experienced a 0.52% decrease in the last 24 hours, with a current price of $0.01833439. However, over the past week, VeChain has shown a growth of 20.92%. VeChain is a blockchain platform focused on supply chain management and has gained attention for its real-world use cases. The recent decrease in VeChain’s value may be a minor correction following its significant growth in the previous period.
7
5

 Manage all your crypto, NFT and DeFi from one place
Securely connect the portfolio you’re using to start.

2
0

0
3

0
0

0
0