
BOME Price Prediction: $BOME Could Explode From This Key Setup

0
0

$BOME is currently trading at $0.0007965. Up 20.7% today. BOME's been around since March 2024, launched on Solana by pseudonymous artist Darkfarms, known for his Pepe meme work.
The idea was a permanent on-chain meme archive, and true to form, supply landed on exactly 69,000,000,420 tokens.
Early on it surged 3,000% and hit a billion-dollar market cap within a day.
Now it's a different question; this BOME price prediction really comes down to whether BOME can finally break the resistance zone that's shut down every real bounce for months.
Live BOME Price Data
$BOME is currently trading at $0.0007965, up 20.7% in a day.
The 24-hour range says plenty on its own, $0.000659 to $0.0008935, a wide swing for a token that's mostly gone sideways this year. 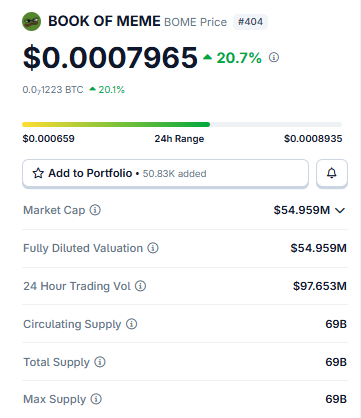
Source: $BOME market cap data taken from Coingecko, data as of Aug 10, 2026. Figures may vary slightly across other tracking websites.
The market cap is around $54.959 million. FDV lines up exactly with that, with no gap at all, since the full 69 billion supply has been circulating since 2024.
No unlocks to worry about here. Daily volume hit $97.653 million, well above BOME's usual pace.
Liquidation Data and Exchange Volume
$844.41K was wiped out over 24 hours, and shorts absorbed most of it, $547.60K against $296.81K on longs. 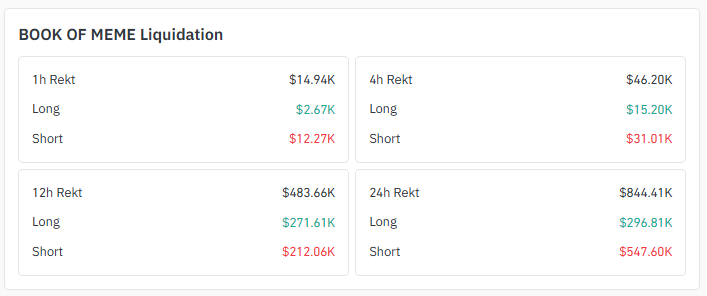
Source: Liquidation Data Taken From Coinglass.
The 12-hour window flips slightly, though, with $483.66K total, with longs actually taking a touch more this time at $271.61K.
Zoom into the shorter windows, and the numbers shrink: $46.20K over 4 hours and $14.94K over 1 hour, both still leaning short.
Two exchanges dominate volume here. Binance at $73.25 million, OKX right behind at $46.67 million. 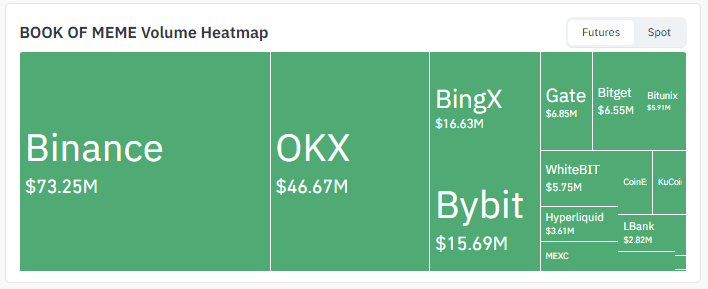
Source: Volume Heatmap Data Taken From Coinglass.
BingX and Bybit sit in the $15-17 million range, and everything else, Gate, Bitget, Bitunix, WhiteBIT, Hyperliquid, LBank, splits what's left.
Key Takeaways
-
$0.0007965, up 20.7% today, one of BOME's better sessions in a while
-
Same old resistance zone again, the one that's rejected every real push for months
-
Shorts bore the brunt of $844K in liquidations over the past day
-
Binance and OKX are doing most of the heavy lifting on volume right now
-
Watch the 1H chart; there's a Wolfe Wave setup that could matter if volume shows up
Technical Analysis: What The Charts Are Saying
Hourly Chart Analysis
The price is touching a rising trendline right now and getting pushed back a bit. 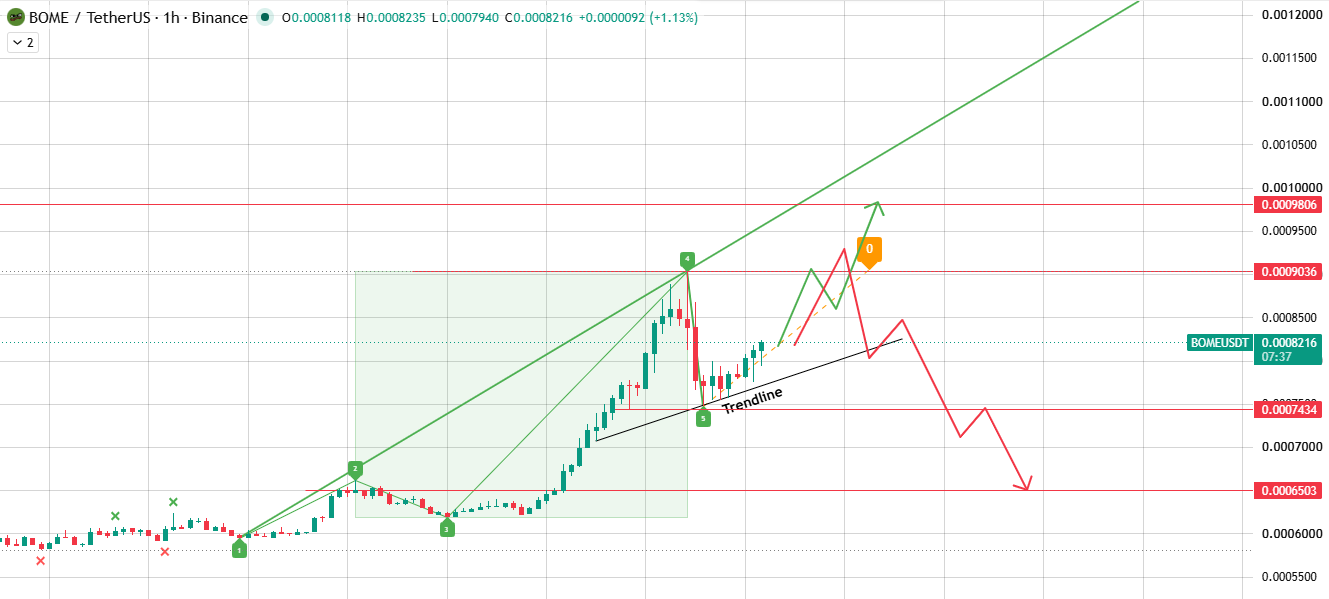
Source: Chart Taken From TradingView .
If it breaks above $0.0009036, that also means $0.0009806 is cleared, and the price has room to move higher.
If it gets rejected here instead and breaks below the trendline, it will likely fall to support at $0.0007434 and then $0.0006503 below that.
There's also a Wolfe Wave pattern forming on this chart. If trading volume picks up, price could move toward that first resistance level.
Daily Chart Analysis
On the bigger picture, $BOME is running into a resistance zone that matches up with a long descending trendline.
Price keeps getting rejected right at this point. 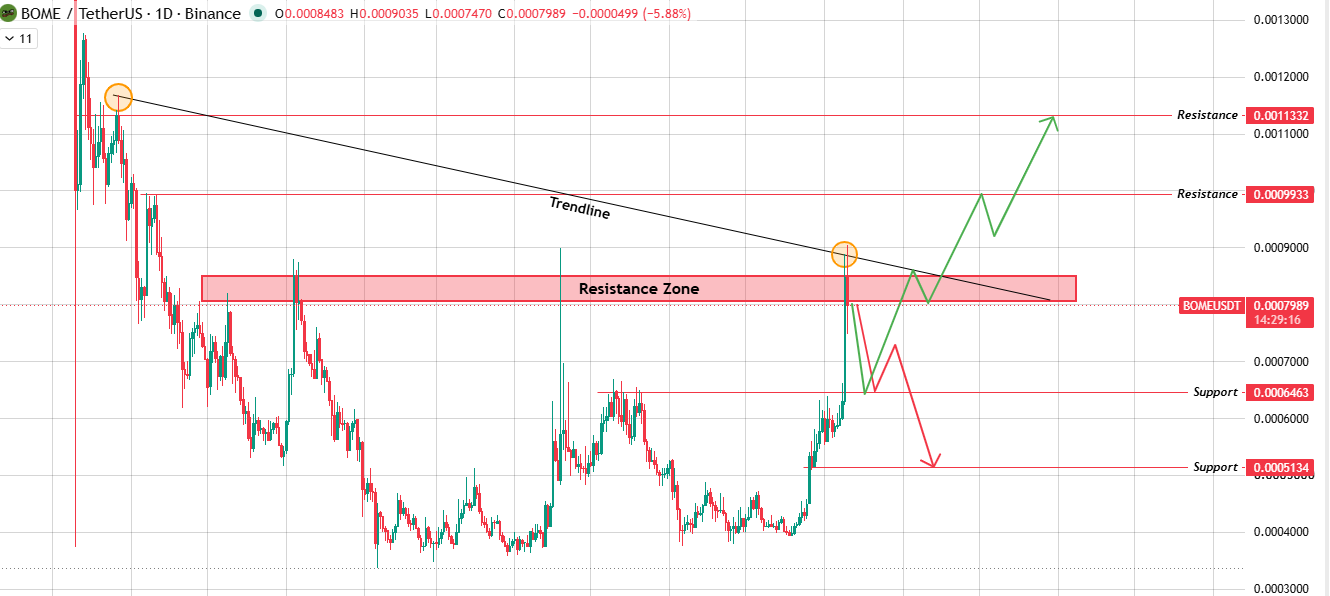
Source: Chart Taken From TradingView.
If it breaks above this zone with strong volume, the next level is $0.0009933, then $0.0011332 after that.
If it fails to break through, the price will likely drop back to $0.0006463, with $0.0005134 as the next support below.
Bull, Base, and Bear Case
Expert Opinion
Most of the talk around BOME right now boils down to one question: does this move actually have the volume to clear a zone that's held for months, or does it fade like every other attempt before it?
Some traders like what they're seeing in that Wolfe Wave setup on the shorter timeframe, figuring a real breakout could travel further than usual if buyers stay committed. Others aren't convinced.
BOME's faked out right here before, more than once, so confirmation matters a lot more than the initial push for anyone actually weighing this BOME price prediction.
Long-Term Outlook
Comes down to that daily resistance zone, plain and simple. Clear it, with volume to back it up, and the broader BOME price prediction shifts meaningfully more bullish toward $0.0011332.
Fail again, and BOME probably just settles back into the range it's been stuck in.
One thing worth remembering, given the fair-launch structure here with zero team allocation and no future unlocks, whatever price does next is pure sentiment and trading activity, not supply pressure.
Glossary
Not a single line but a whole band of prices, that's what a resistance zone really is, a range where selling has repeatedly capped things.
Ever come across a Wolfe Wave? It's a five-wave pattern traders use to spot potential reversals, usually confirmed once volume picks up near the projected level.
A trendline just connects a series of highs or lows, showing which way a trend's leaning, and it can act as support or resistance depending on direction.
Liquidation happens when an exchange force-closes a leveraged bet because the trader can't cover the losses piling up.
FDV, or fully diluted valuation, is total supply times current price. Same number as market cap here, since BOME's entire supply already circulates.
Methodology
This BOME price prediction leans on TradingView chart readings across the 1-hour and 1-day timeframes, paired with liquidation and volume data from Coinglass.
Every support, resistance, and trendline level comes straight from observable chart structure, nothing extrapolated.
Given how often BOME's faked out at similar levels before, treat this as one input in a bigger decision, not a standalone signal.
Disclaimer: This article is for informational purposes only and does not constitute financial advice. Cryptocurrency markets are highly volatile, and past price behavior does not guarantee future results. Always conduct independent research before making investment decisions.
0
0


 Manage all your crypto, NFT and DeFi from one place
Securely connect the portfolio you’re using to start.


