Hyperliquid Hits a 3-Month High – What’s Next for HYPE?

0
0

Hyperliquid (HYPE) continues to be one of the most dominant players in crypto, accounting for 65% of daily perpetuals market volume and generating $15.58 million in fees over the past seven days. The surge in activity has pushed HYPE to a 3-month high, but technical indicators now suggest the rally may be losing steam.
Momentum signals like DMI and RSI point to cooling strength, while price action hovers near a key support level. Whether HYPE breaks above resistance or slips into a deeper pullback could define its next major move.
HYPE DMI Signals Fading Bullish Momentum as ADX Hovers Near Key Level
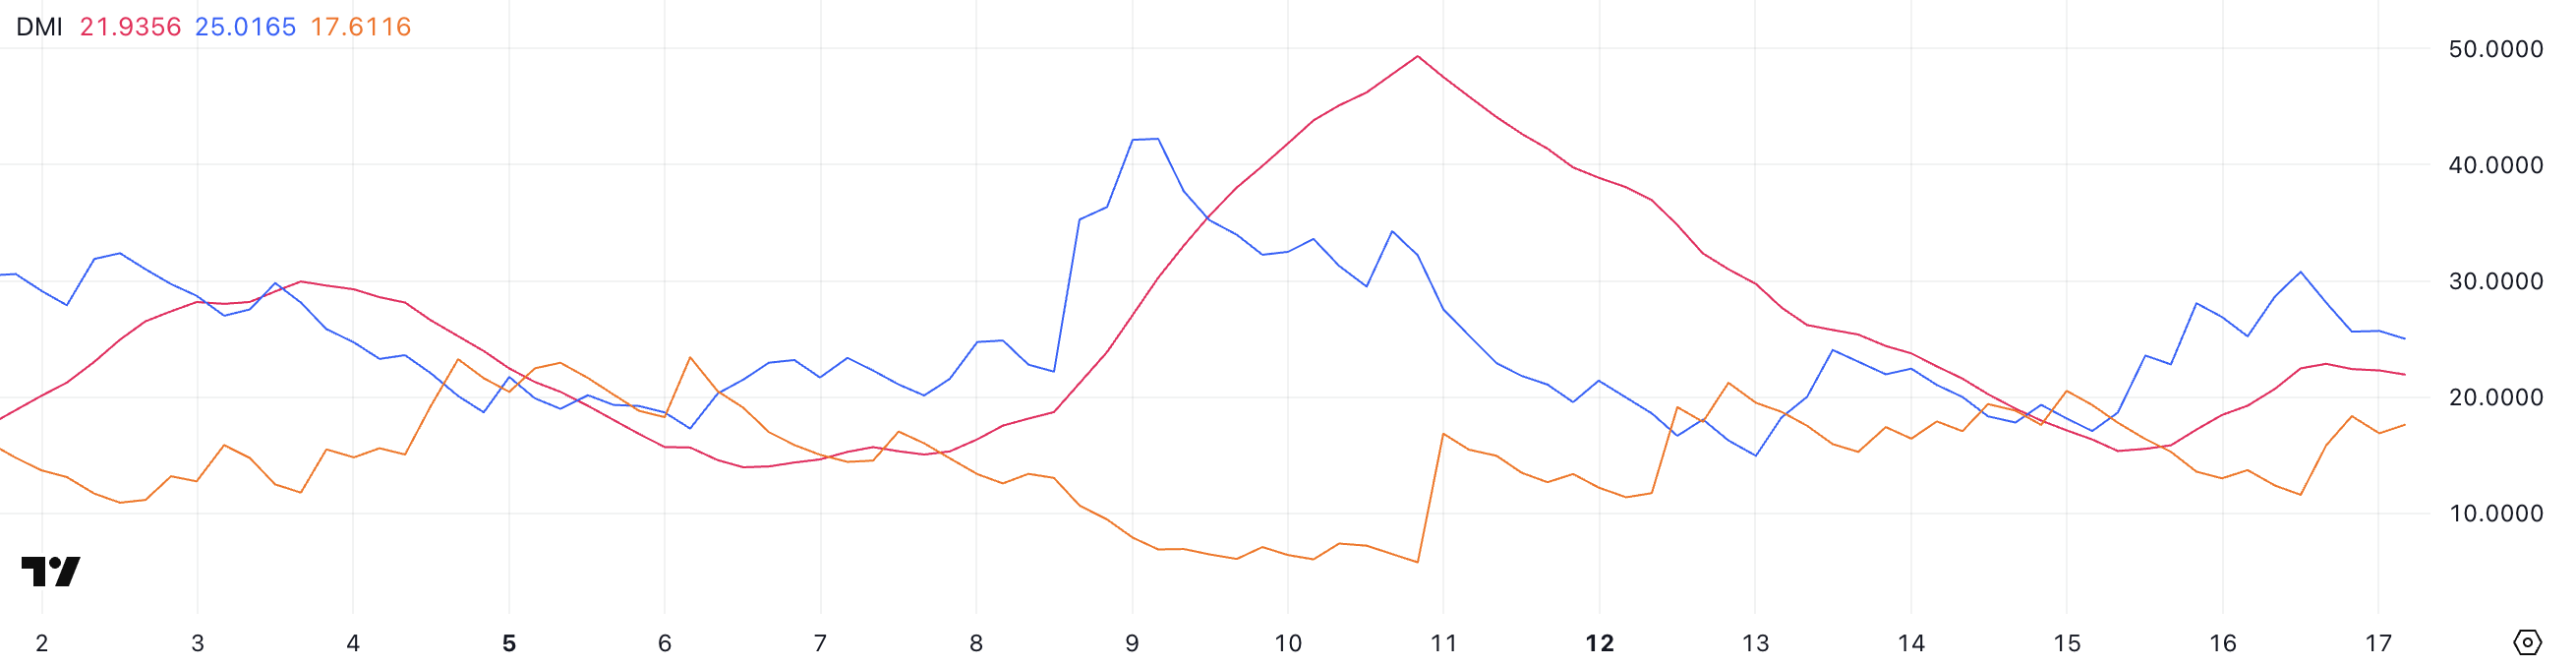
HYPE’s Directional Movement Index (DMI) shows mixed signals, with its ADX currently at 21.93.
That’s a slight drop from 22.85 yesterday and 24.39 four days ago, but still higher than the 15.34 recorded two days ago.
The ADX measures trend strength, not direction, and readings above 20 indicate a potential trend is forming, while values below 20 suggest a weak or ranging market.
 HYPE DMI. Source: TradingView.
The +DI, which measures bullish pressure, is now at 25—up from 17 two days ago but down from a strong 30.78 yesterday. Meanwhile, the -DI, which tracks bearish pressure, has risen to 17.61 from 11.57.
This suggests that although bullish momentum is still stronger than bearish, it’s starting to weaken, while selling pressure is slowly rising.
If this trend continues, it could signal a loss of upside strength and a possible shift toward consolidation or short-term correction.
Hyperliquid RSI Drops Below 60, Signaling Cooling Momentum
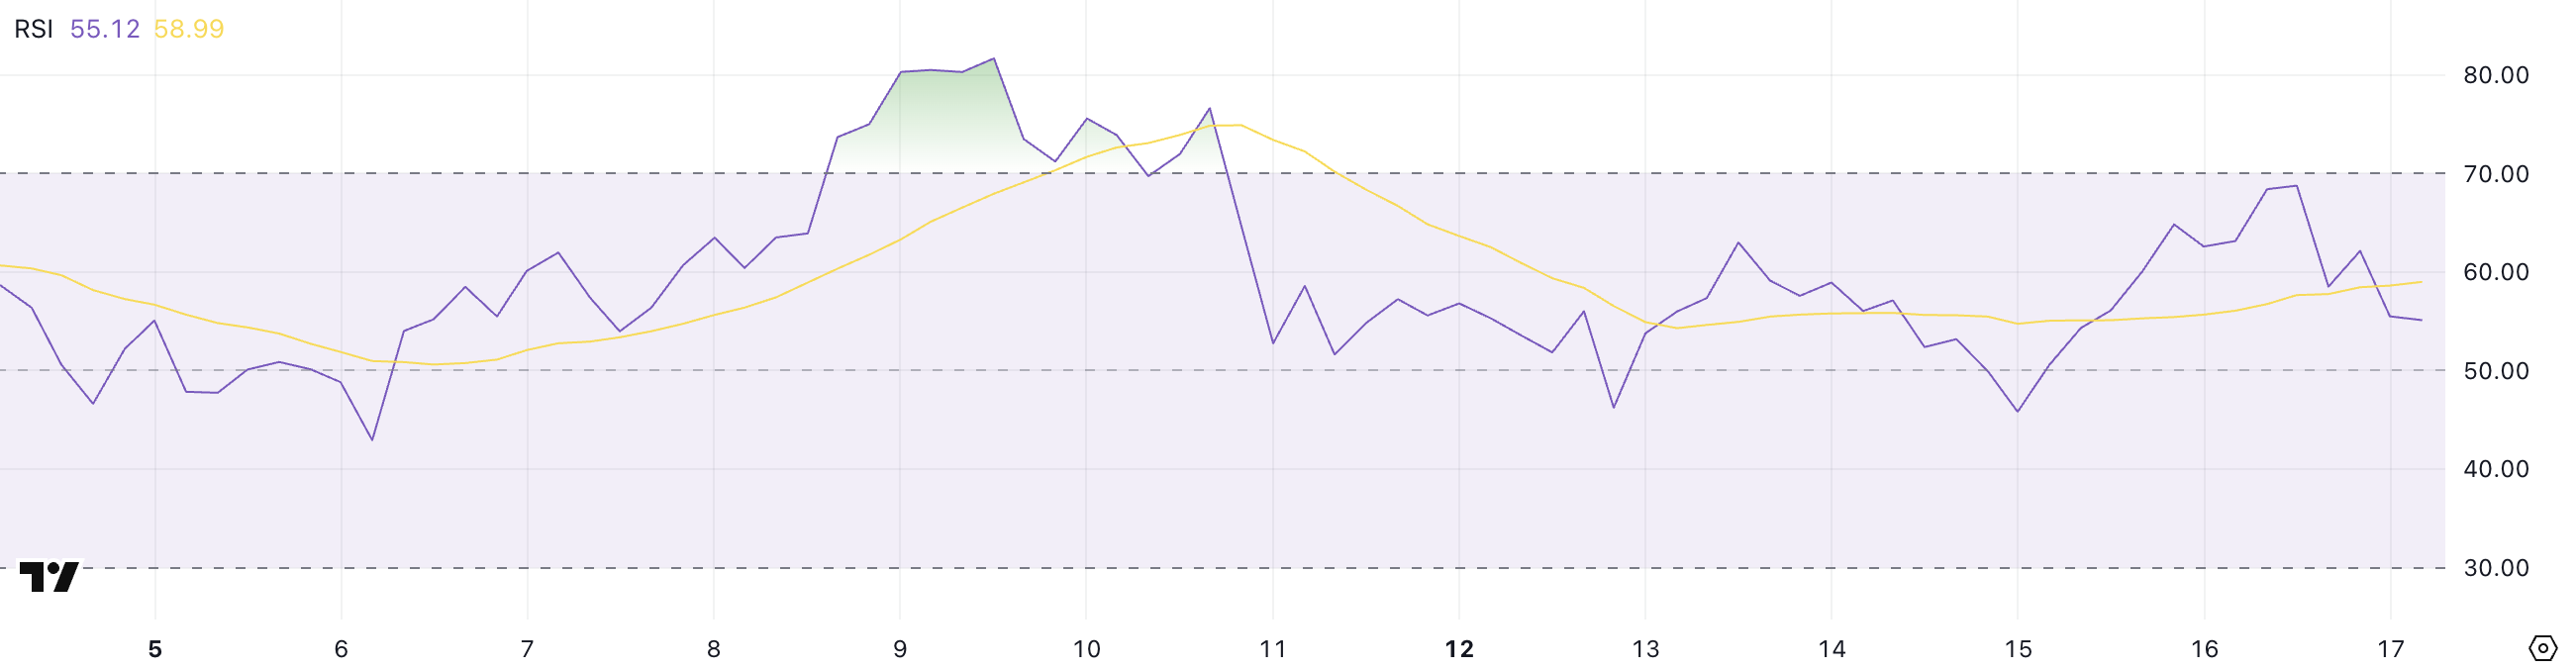
Hyperliquid’s RSI has dropped to 55.15, down from 68.76 yesterday, after rising from 45.82 just two days ago. The Relative Strength Index (RSI) is a momentum oscillator that tracks the speed and magnitude of price movements on a scale from 0 to 100.
RSI values above 70 suggest an asset may be overbought and due for a correction, while values below 30 indicate oversold conditions and the potential for a bounce.
Levels between 50 and 60 often reflect a neutral or slightly bullish stance, depending on trend context.
 HYPE RSI. Source: TradingView.
The sharp drop in RSI suggests that HYPE’s recent bullish momentum is fading. While 55.15 still sits in a neutral zone, the reversal from near-overbought conditions may signal buyer exhaustion.
If follow-through buying doesn’t return, this could lead to a cooling-off phase or short-term consolidation.
If RSI stabilizes above 50, it may reflect a healthy reset within a broader uptrend, but further decline could open the door for a deeper pullback.
HYPE Holds Key Support at $26.41 With Eyes on $30 Breakout
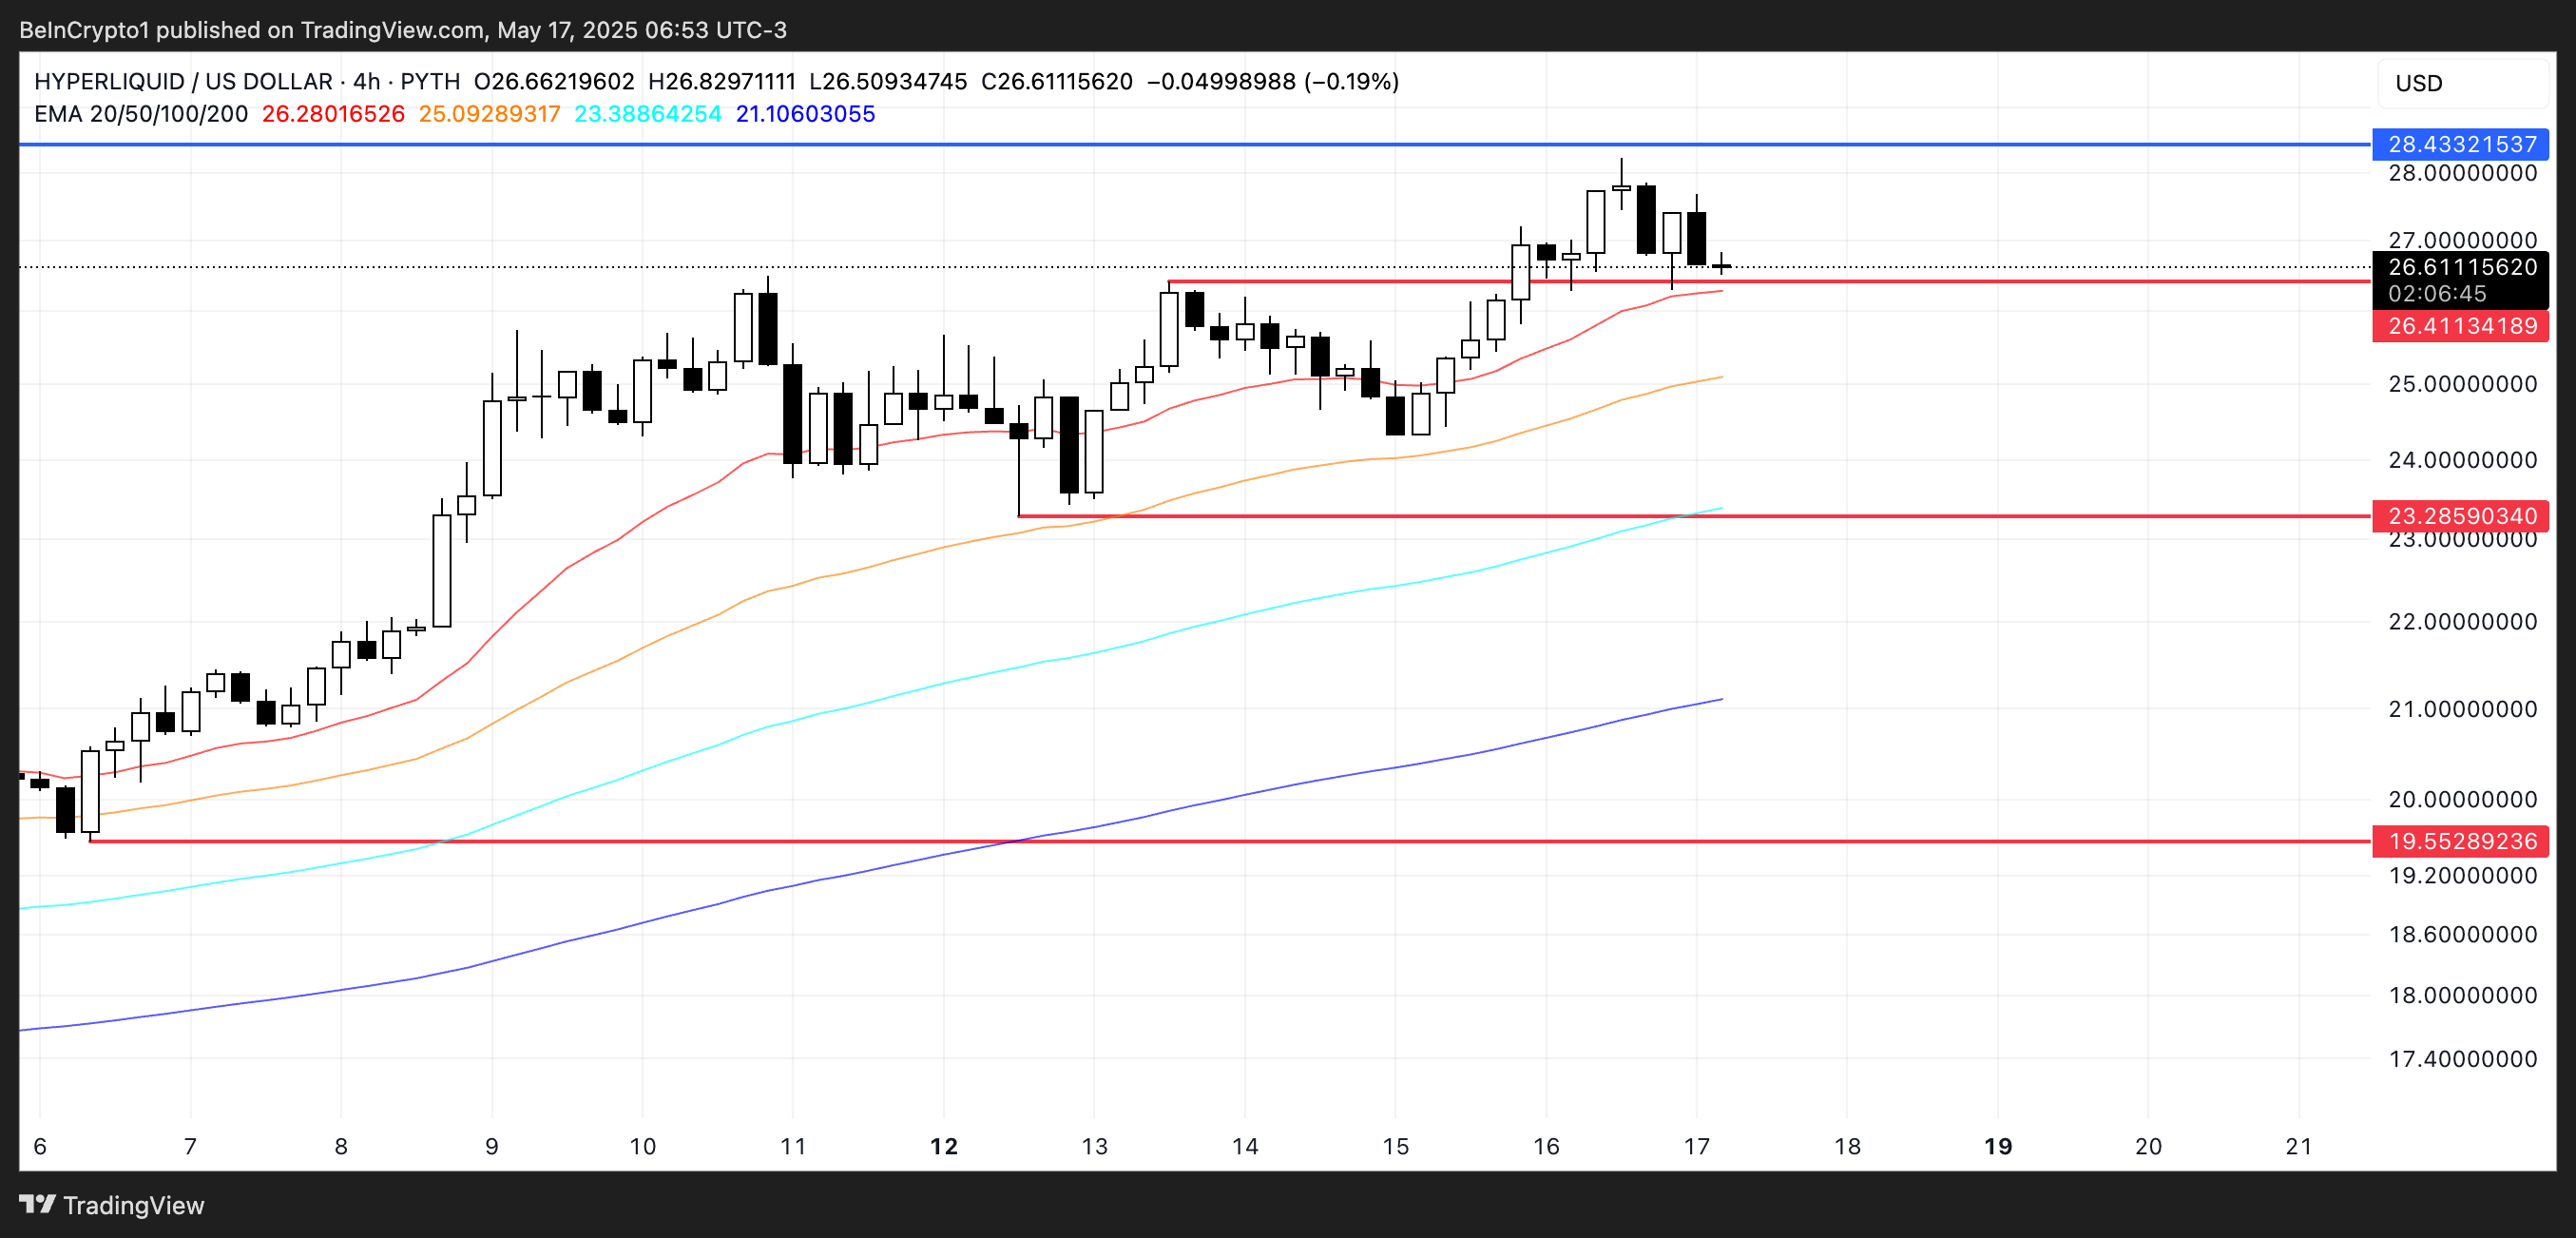
HYPE is currently hovering just above a key support level at $26.41, a zone that could decide its next major move.
The EMA structure remains bullish, with short-term averages still positioned above long-term ones, suggesting the broader trend is intact.
 HYPE Price Analysis. Source: TradingView.
However, if this support fails under pressure, Hyperliquid could drop toward $23.28, with a deeper decline possibly extending to $19.55 in a strong downtrend.
On the flip side, if the $26.41 support holds and buyers step in, the next key test lies at the $28.43 resistance. A successful breakout above that level would open the door for a push toward $30—territory not seen since December 2024.
0
0


 Manage all your crypto, NFT and DeFi from one place
Securely connect the portfolio you’re using to start.


0
0

